
Income Insufficiency Methodology
Income insufficiency is a measure of financial hardship that compares family income to estimated family expenses. While poverty rates are widely used as a measure of financial hardship, there is some evidence that poverty rates rely on outdated assumptions, which can lead to underestimated family expenses and financial hardship[1]. Forsyth Futures developed the income insufficiency measure to supplement analysis of financial hardship based on poverty rates. The income insufficiency measure accounts for factors not considered in poverty calculations.
This measure begins by documenting expense estimates, which represent the lowest cost of living that can be generally assumed for various family situations. This is followed by an analysis of income insufficiency rates, which are the percentages of residents living in families with incomes that are lower than their estimated expenses. The expense estimates used to calculate income insufficiency rates are based on demographic and geographic factors not considered in poverty calculations, as well as how each expense changes over time.
- National Research Council (1995). Measuring poverty: A new approach. Washington, D.C.: National Academy Press. Retrieved from: https://www.nap.edu/read/4759
Expense Category Source Name Source Institution Geographic Level of Data Circumstances Accounted for
Childcare Personal Correspondence North Carolina State University State Age, presence of nonworking adults who could provide free childcare
Food Low Cost Food Plan US Department of Agriculture Region Age, sex
Housing Fair Market Rents US Department of Housing and Urban Development County Family and household size/comparison
Transportation Consumer Expenditure Survey Bureau of Labor Statistics Region Family size
Healthcare Medical Expenditure Panel Survey US Department of Health and Human Services Region Family size
Health Insurance Consumer Expenditure Survey Bureau of Labor Statistics Region Family size, age
Other Expenses Consumer Expenditure Survey Bureau of Labor Statistics Region Family size
Taxes Federal and State Tax Codes//Taxsim US Congress National and State Income, wages, standard deduction, exemptions, some credits
This table outlines sources for these expenses, each of which is similar or identical to those used by MIT and/or the United Way. All estimates are as sensitive to location and family circumstance as the available data allows. Countywide expense data were used whenever possible, however most expense categories were based on expense data calculated at the state or regional (Northeast, Midwest, South, West) level.
One Adult Two Working Adults Two Parents, One Working, with a 2 and 4 year old Two Working Adults with a 2 and 4 year old One Adult with a 2 and 4 year old
Childcare $0 $0 $0 $16,962 $16,962
Food $2,867 $5,369 $8,601 $8,601 $5,734
Housing $6,996 $6,996 $8,748 $8,748 $8,748
Transportation $4,620 $8,457 $12,638 $12,638 $10,571
Healthcare $430 $860 $1,030 $1,030 $600
Health Insurance $2,116 $4,232 $4,111 $4,111 $3,818
Other Expenses $2,562 $4,265 $5,615 $5,615 $4,621
Taxes $3,537 $4,483 -$5,076 $6,221 $7,078
Total Estimated Expenses $23,128 $34,662 $35,667 $63,926 $58,132
This table shows the estimated expenses for several example households in Forsyth County. Compared to families with no children, families with two preschoolers in need of full-time childcare are estimated to have about $25,000 to $30,000 more in expenses. Over half of this increase is from childcare and associated taxes. The example families above have children not attending school, which have the highest childcare expenses. School-aged children with working parents still have childcare expenses for after-school and summer care.
One Adult Two Working Adults Two Aduts, One Working, with a 2 and 4 year old Two Working Adults with a 2 and 4 year old One Adult with a 2 and 4 year old
Total Estimated Expenses $23,128 $34,662 $35,667 $63,926 $58,132
Poverty Threshold $13,300
$17,196
$25,926
$25,926
$20,598
This table shows that total estimated expenses are consistently higher than the federal poverty threshold used by the Census Bureau to determine poverty status.This table shows the hourly wages that workers in each example family would need to cover their estimated expenses with full-time (2,080 hours a year) work. None of the example families would be able to meet their estimated expenses with full-time minimum-wage work. Some families with children would be unable to meet their estimated expenses earning twice or three times the minimum wage.
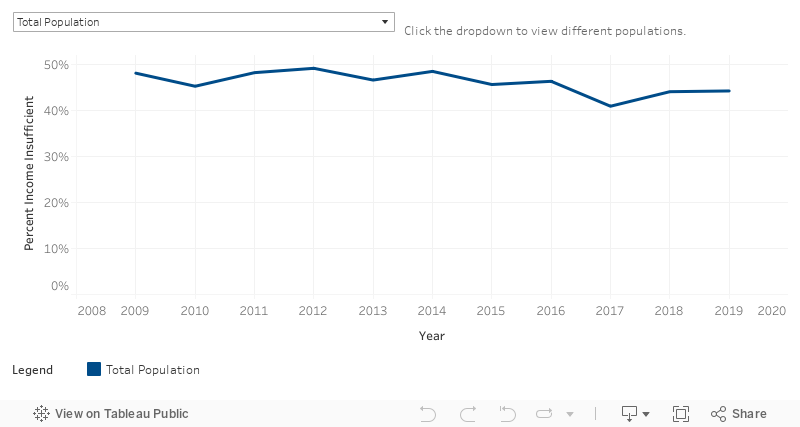
The income insufficiency rate was generally similar across time and comparison communities. The income insufficiency rate in Forsyth County was lowest in 2010 at 28% which is significantly lower than the 2018 rate of 34%. Forsyth County, Durham County, and Guilford County all have similar percentages of income insufficient residents, but North Carolina’s income insufficiency rate is about 3% lower than Forsyth County’s.
Disparities were present in income insufficiency rates by age. Residents between the ages of 45 to 64 had the lowest rate of insufficient income among all age groups. A little more than half of young adults age 18 to 24 and about 46% of children lived in households with insufficient income.
Disparities are present in income insufficiency rates by race/ethnicity. About half of African American and 62% of Hispanic/Latino residents lived in families with insufficient income compared to 22% of White, non-Hispanic residents.
The Census Bureau defines the poverty level of families based only on income, family size, and the number of children and adults 65 and over[2]. It does not consider location or any other factor that could influence expenses. As a result, in 2016, the average family of four was not considered to be in poverty if they had an income of at least $24,563, regardless of whether they lived in New York City or rural North Carolina. Additionally, there is some evidence that these estimates rely on outdated assumptions, which cause them to underestimate family expenses and financial hardship[1]. The flaws in the current measure are widely recognized. While researchers have been actively investigating alternative methodologies[3], the Census Bureau has not replaced its poverty calculations and researchers continue to commonly use Census Bureau poverty statistics[4].
Forsyth Futures attempted to address shortcomings in poverty calculations by creating alternative expense estimates based on a more detailed consideration of family circumstances. It built on similar analyses in the Self-Sufficiency Standard created by the Center for Women’s Welfare at the University of Washington for the United Way and the Living Wage Calculator developed by Dr. Amy Glasmeier at the Massachusetts Institute of Technology (MIT). Forsyth Futures’ model estimates eight categories of expenses:
- childcare
- food
- housing
- transportation
- healthcare
- health insurance
- other expenses
- taxes.
These estimates represent the lowest cost of living that can be generally assumed for each family type based on the information available; they are designed to identify income levels that could reasonably support families of different sizes.
- National Research Council (1995). Measuring poverty: A new approach. Washington, D.C.: National Academy Press. Retrieved from: https://www.nap.edu/read/4759
- S. Department of Commerce. (2017). Poverty thresholds – 2016 [Data File]. Retrieved from: https://www.census.gov/data/tables/time-series/demo/income-poverty/historical-poverty-thresholds.html
- Short, K. S. (2005). Material and financial hardship and income-based poverty measures in the USA. Journal of Social Policy, 34(1), 21-38. doi: 10.1017/S0047279404008244
- Chetty, R, & Hendren, N. (2015). The impact of neighborhoods on intergenerational mobility: County-level estimates . Retrieved from: https://scholar.harvard.edu/files/hendren/files/nbhds_paper.pdf
Calculation of Expense Estimates
The Census Bureau defines the poverty level of families based only on income, family size, and the number of children and adults 65 and over[2]. It does not consider location or any other factor that could influence expenses. As a result, in 2019, the average family of four was not considered to be in poverty if they had an income of at least $25,926, regardless of whether they lived in New York City or rural North Carolina. Additionally, there is some evidence that these estimates rely on outdated assumptions, which cause them to underestimate family expenses and financial hardship[1]. The flaws in the current measure are widely recognized. While researchers have been actively investigating alternative methodologies[3], the Census Bureau has not replaced its poverty calculations and researchers continue to commonly use Census Bureau poverty statistics[4].
Forsyth Futures attempted to address shortcomings in poverty calculations by creating alternative expense estimates based on a more detailed consideration of family circumstances. It built on similar analyses in the Self-Sufficiency Standard created by the Center for Women’s Welfare at the University of Washington for the United Way and the Living Wage Calculator developed by Dr. Amy Glasmeier at the Massachusetts Institute of Technology (MIT). Forsyth Futures’ model estimates eight categories of expenses:
- childcare
- food
- housing
- transportation
- healthcare
- health insurance
- other expenses
- taxes.
These estimates represent the lowest cost of living that can be generally assumed for each family type based on the information available; they are designed to identify income levels that could reasonably support families of different sizes.
Appendix: Notes on data analysis and interpreting expense estimates and income insufficiency rates.
Expense estimates represent the best estimates that Forsyth Futures could make with the data available. The notes below detail key considerations when using expense estimates and income insufficiency rates.
Note on Data Analysis
The data provided in this report come from the Census Bureau’s American Community Survey (ACS). The ACS asks questions similar to those found in the Decennial Census, but does not survey every household. As a result, there is still some uncertainty around estimates that are based on this survey. This uncertainty is measured before any estimates or comparisons are reported. Estimates are only referred to as being higher or lower than another when the difference is statistically significant, meaning that there is at least a 95% likelihood that the two numbers are different when the uncertainty of the estimates is considered.
Literature References
- National Research Council (1995). Measuring poverty: A new approach. Washington, D.C.: National Academy Press. Retrieved from: https://www.nap.edu/read/4759
- S. Department of Commerce. (2017). Poverty thresholds – 2016 [Data File]. Retrieved from: https://www.census.gov/data/tables/time-series/demo/income-poverty/historical-poverty-thresholds.html
- Short, K. S. (2005). Material and financial hardship and income-based poverty measures in the USA. Journal of Social Policy, 34(1), 21-38. doi: 10.1017/S0047279404008244
- Chetty, R, & Hendren, N. (2015). The impact of neighborhoods on intergenerational mobility: County-level estimates . Retrieved from: https://scholar.harvard.edu/files/hendren/files/nbhds_paper.pdf
Data References