
Community Data
Reliable, local data encourages and supports data-informed decision making by community stakeholders at all levels. This information is designed to simplify the process of using data to inform the work that moves our community forward — program planning and evaluation, funding and resource allocation, grant writing, and more.
Community Research Framework
Individual Forsyth Futures reports are generally written to provide focused information on specific issues to inform community action. While these topics are generally measured in separate reports for clarity, it is important to acknowledge that all of the local issues we study are interconnected. For example, food insecurity is generally measured separately from reading proficiency scores, but in reality being a part of a family experiencing food insecurity can have a significant impact on children’s ability to learn and be successful in school.
Two Complementary Frameworks
To guide our reporting as we navigate this complexity, Forsyth Futures uses two frameworks which consider interconnected topical dimensions and dimensions of context and scale, respectively. Taken together, these two frameworks provide an opportunity for community stakeholders to consider how issues that appear separate in their reporting may be interconnected.
Interconnected Topical Dimensions

Built and Physical Environment
Economy and Financial Stability
Education
Health and Wellness
Safety
Social and Civic Environment
This framework model shows that despite how topics are separated to make information easier to access and communicate, many of the sectors that we study are interconnected, like a student’s economic stability and their ability to be successful in school.
Dimensions of Context and Scale

Individuals
Networks of Familes, Friends, Neighbors and Civic Groups
Community Systems
This framework model is based on a commonly-used social determinants of health model called the Social-Ecological model. This model illustrates how individuals and families are impacted by the broader contexts in which they exist. For example, an individual child’s test score measures their reading proficiency at the individual level, but it is important to acknowledge the impact that a child’s family, neighborhood, and school have on the child’s success.
Demographics
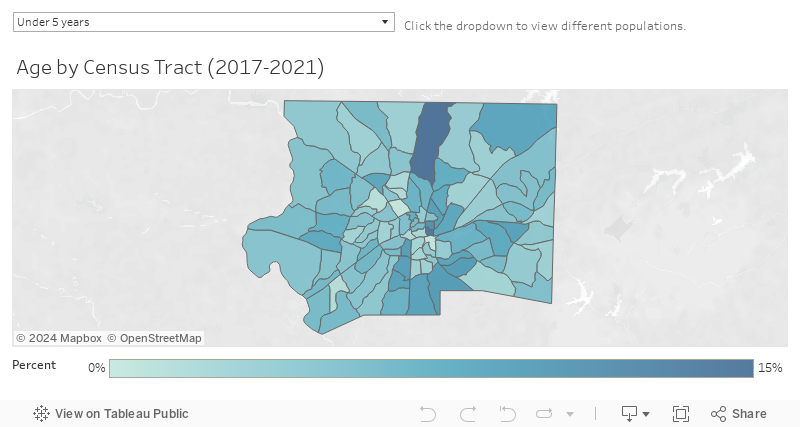
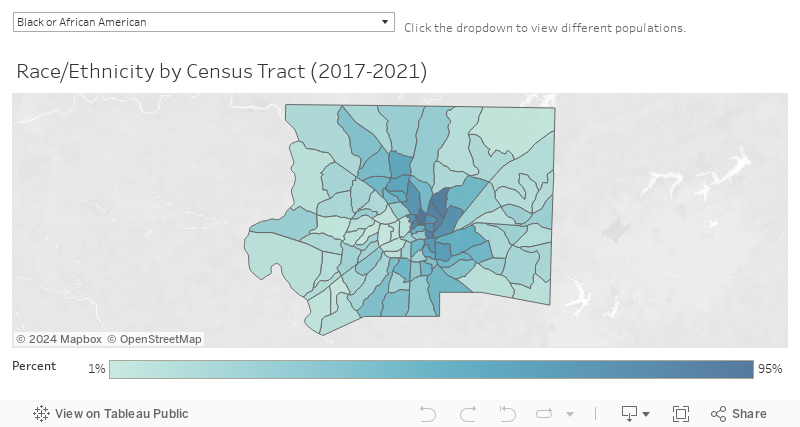
Demographic data includes information on Forsyth County’s population as well as sub-populations within the county based on factors such as geography, gender, age, and race/ethnicity.
Total Population
Population by Age
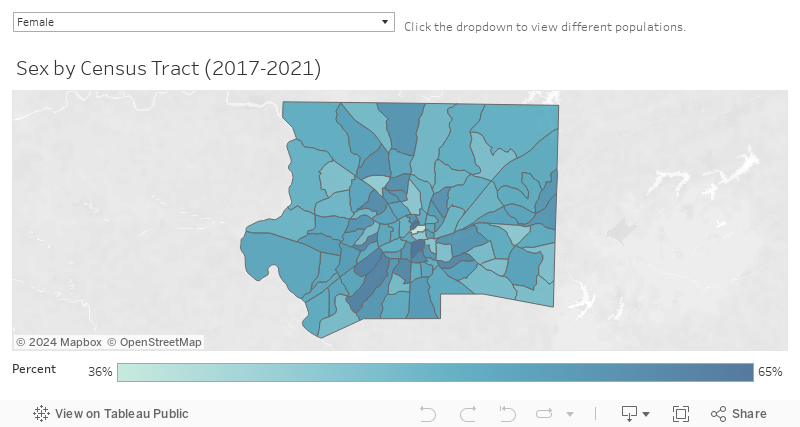
Population by Gender

Population by Race/Ethnicity

Population by Gender and Race/Ethnicity

Population by City
Reports and Briefings

2020 Key Measures Report
Produced by Forsyth Futures.
Forsyth Futures’ Key Measures Report serves as a compilation of recent, commonly-requested, community-specific, reference information to aid informed public consideration and grant-writing activities in Forsyth County. The contents of this report address demographics and various topics related to the economy, health and wellness, education, and safety in Forsyth County.

Age-Friendly Forysth 2017 Community Report
Produced by Age-Friendly Forsyth in partnership with Senior Services Inc. and Forsyth Futures, 2017.
When you think of an age-friendly community, what comes to mind? What needs to be improved to make Forsyth County the place to live your best life? We set out to answer these questions in the first phase of Age-Friendly Forsyth, a collaborative community effort that focuses on optimizing opportunities and enhancing quality of life as people age. The full report is the culmination of a year-long effort, involving many community residents and organizations, to collect views and perspectives on aging in Forsyth County. This is a snapshot of where we are now, and it establishes a baseline from which we can measure future growth.

Demographic and Workforce Data Request
Produced by Forsyth Futures, 2016.
Information was requested on Winston-Salem/Forsyth County demographics and workforce. The request was specifically interested in information on the following: educational attainment by race/ethnicity, unemployment levels by race, drop out rates by race, average salary/household inccome by race, and other high-level employment and workforce data broken out by race/ethnicity for the Winston-Salem/Forsyth County.
Built and Physical Environment
Community Impact
The conditions of our local environment’s soil, water, and air are fundamental to healthy communities and an attractive quality of life. Associated energy, land use, and waste management systems further indicate the trajectory and health of these communities in ways that support or undermine many economic and healthcare outcomes. These interlinking relationships, and the way they disproportionately impact different areas and populations, are important to consider when exploring the distinct environmental indicators one-by-one.
Key Measure
Air Quality
The Air Quality Index (AQI) is a measurement used to communicate the level of air pollution to the public and what associated health risks may be a concern. With increasing levels of pollution, the index number will increase. These numbers are determined by calculating the average of readings over a period of time. For Forsyth County, the air quality is calculated hourly at multiple monitoring stations. Each pollutant is measured and considered in the final index.
The AQI is calculated using standards set by the Clean Air Act (CAA). The standards relating to the CCA are focused on five common pollutants: particulate matter (PM), ozone (O3), sulfur dioxide (SO2), nitrogen dioxide (NO2), and carbon monoxide (CO). The EPA has established national air quality standards for each of these pollutants to protect public health[1].
Air Quality Index Levels
| Level | Index Range | Explanation |
|---|---|---|
| Good | 0 - 50 | Air pollution poses little or no risk. |
| Moderate | 51 - 100 | For some pollutants there may be a moderate health concern for a very small number of people. |
| Unhealthy for Sensitive Groups | 101 - 150 | The general public is not likely to be affected at this AQI range, but people with lung disease, older adults, and children are at a greater risk from exposure to ozone and from the presence of particles in the air. |
| Unhealthy | 151 - 200 | Everyone may begin to experience some adverse health effects, and members of the sensitive groups may experience more serious effects. |
| Very Unhealthy | 201 - 300 | This triggers a health alert signifying that everyone may experience more serious health effects. Everyone should avoid prolonged or heavy exertion. |
The chart describes the AQI levels and associated index range. If an area reports an AQI of 25, then that day falls within the ‘Good’ range. However, if they report an AQI of 115, this falls within the orange category: ‘Unhealthy for Sensitive Groups' and so forth. Each level has suggested level of outdoor activity for certain groups of people.
- The Clean Air Act, Amendments of 1990, 42 U.S.C. §7401et seq, (1990)
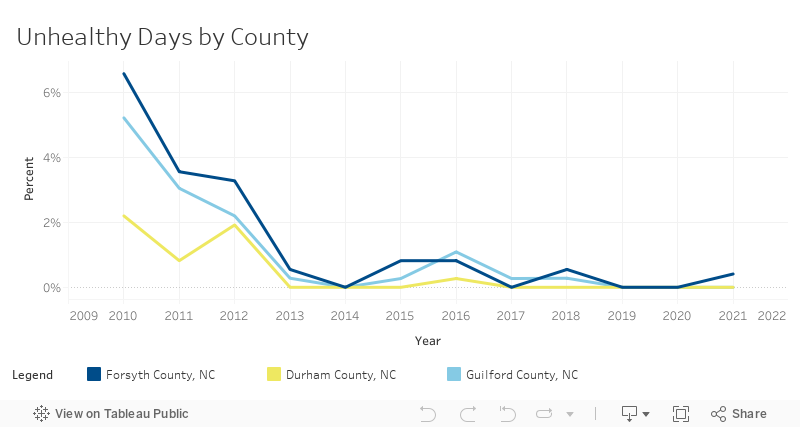
There was only one day (<.05%) with an AQI considered unhealthy, or more than 100, in 2021 in Forsyth County. AQI values below 100 are generally thought of as satisfactory; it corresponds to the national air quality standard that the EPA has set to protect public health. When AQI values are above this threshold, the air quality is considered unhealthy.
Unhealthy Days represents a combination of Unhealthy Days and Unhealthy Days for Sensitive Groups, and the percentage is based on the number of days the Air Quality Index (AQI) was collected for each county which is not always equal to days in a calendar year. For example, in 2021 the AQI for all three counties was collected for 243 days.
Data Sources
- U.S. EPA (2021). Annual Summary Data from AQI by County. Retrieved from https://aqs.epa.gov on December 21, 2021.
If you are interested in using data from this report for rigorous purposes (such as program planning), please contact info@forsythfutures.org for a consultation on how best to proceed.
Reports and Briefings

Forsyth County Community Food System
Produced by Forsyth Futures, 2013
In 2010, The Women’s Fund published a report on women and girls in our community — the first time that data on the lives of more than half of our population had ever been assembled. That report, Through a Gender Lens: The Economic Security of Women and Girls in Forsyth County, told us a great deal about work, wages, poverty, education, and healthcare at the time, and women’s strengths overall and challenges they face. Women in our community were resilient, but too many were living without the financial resources they needed for a safe and secure life for themselves and for their children. We resolved to do better.
Economy and Financial Stability
Community Impact
The capacity of local small businesses and corporations to provide important customer goods and services, employment opportunities, and healthy wages is essential. Additionally, how different populations relate to income, wealth, and economic opportunity are key indicators of how well families can meet their needs sufficiently and how well communities can support them equitably.
Key Measures
Employment
Employment rates play a significant role in understanding our local economy. The employment rates presented here represent the percentage of the population that is at least 16 years old and employed for the total population and for all demographic breakdowns except sex. The employment rate by sex represents those that are between the ages of 20 to 64. Following a recession, the employment rate tends to not grow to any significant extent until the remainder of the economy has recovered, making it a lagging indicator [1].
- Pew Charitable Trust. (2013). Hard choices navigating the economic shock of unemployment. Retrieved from http://www.pewtrusts.org/~/media/legacy/uploadedfiles/pcs_assets/2013/empreportoverviewhardchoicesnavigatingtheeconomicshockofunemploymentpdf.pdf
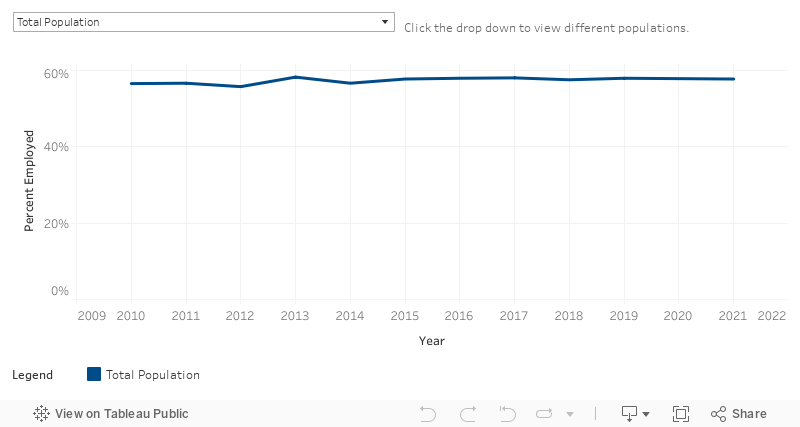
The employment rate remained relatively stable in Forsyth County from 2010-2021.
All comparison communities’ employment rate ranged from 57% to 62% in 2021. The employment rate in Forsyth County was 58% which was 4% lower than Durham County’s and 3% lower than Guilford County’s employment rate.
Disparities were present in employment rates for residents by age. In 2021, Forsyth County residents between the ages of 25 and 44 had an employment rate of 79% compared to 44% of 16 to 24 year olds and 70% of 45 to 64 year olds.
Disparities were present in employment rates for residents by sex for most years. The employment rate for male workers was consistently higher than the employment rate for female workers from 2010 to 2019. In 2021, the gap is smaller and within the margins of error, so analysts cannot be confident that the employment rates of males and females are different.
The employment rate in 2021 was similar for Black or African American and non-Hispanic White residents. Black or African American respondents' lowest employment rate was at 49% in 2011 which increased to 57% in 2021 and is comparable to White residents' employment rate of 56% in 2021.
Due to pandemic disruptions, 2020 data is not comparable to previous years. To learn more about these disruptions click here.
The Census suppressed several Hispanic/Latino estimates due to the small sample sizes in particular years.
Data Sources
- U.S. Census Bureau (2022). Employment Status: Table S2301, 2006-2019 and 2021 American Community Survey 1-Year Estimates. Retrieved from data.census.gov.
- U.S. Census Bureau (2022). Employment Status: Table S2301, 2017-2021 American Community Survey 5-Year Estimates. Retrieved from data.census.gov.
If you are interested in using data from this report for rigorous purposes (such as program planning), please contact info@forsythfutures.org for a consultation on how best to proceed.
Homeownership
The homeownership rate describes the percent of households who own their home. Owning a home, or other assets such as savings accounts, investments, and vehicles provides financial security that can protect households from unexpected expenses and decrease the likelihood of experiencing poverty[1]. While homeownership rates do not indicate overall wealth, or even the value of homes, they do indicate ownership of a valuable asset, which could provide financial security[1].
When determining homeownership rates by age and race/ethnicity, this indicator only considers the age and race/ethnicity of the householder, who is the individual who filled out the Census Bureau’s American Community Survey.
- Cramer, R. & Shanks, T. (2014). The assets perspective: The rise of asset building and its impact on social policy. New York, NY: Palgrave Macmillan.
Homeownership rates in Forsyth County have ranged from 58% to 66% from 2006 to 2021. In 2021, the homeownership rate was 65% in the county.
Durham County had the lowest homeownership rate of all the comparison communities. In 2021, 55% of households in Durham County owned their own homes while 63% to 67% of households in the other comparison communities owned their own homes.
There are homeownership rate differences by age. Those under the age of 35 had the lowest homeownership rate among all age groups.
Racial and ethnic disparities in homeownership were large. White residents had consistently higher rates of homeownership compared to Black or African-American and Hispanic/Latino residents. In 2021, 74% of non-Hispanic White residents owned their homes compared to 48% of Black or African-American residents and 51% of Hispanic/Latino residents.
Due to pandemic disruptions, 2020 data is not comparable to previous years. To learn more about these disruptions click here.
Age Group: Due to the small sample size of 35 to 64 year olds and 65 years old and over in 2018,2019, and 2021 the estimates are not as reliable. Additionally, the estimate of those 65 years old and over in 2010 and those 15 to 34 years old in 2021 are not as reliable due to their small sample sizes and should be interpreted with caution.
Race/Ethnicity: With the exception of 2015, due to the small sample size of the Hispanic/Latino population, the homeownership rates for Hispanic/Latino residents are not as reliable.
Data Sources
- U.S. Census Bureau (2022). Tenure: Table B25003, 2006-2019 and 2021 American Community Survey 1-Year Estimates. Retrieved from data.census.gov.
- U.S. Census Bureau (2022). Tenure by Age of Householder: Table B25007, 2006-2019 and 2021 American Community Survey 1-Year Estimates. Retrieved from data.census.gov.
- U.S. Census Bureau (2022). Tenure (Black or African American Alone Householder): Table B25003B, 2006-2019 and 2021 American Community Survey 1-Year Estimates. Retrieved from data.census.gov.
- U.S. Census Bureau (2022). Tenure (Hispanic or Latino Householder): Table B25003I, 2006-2019 American and 2021 Community Survey 1-Year Estimates. Retrieved from data.census.gov.
- U.S. Census Bureau (2022). Tenure (White Alone, Not Hispanic or Latino Householder): Table B25003H, 2006-2019 and 2021 American Community Survey 1-Year Estimates. Retrieved from data.census.gov.
- U.S. Census Bureau (2022). Tenure: Table B25003, 2017-2021 American Community Survey 5-Year Estimates. Retrieved from data.census.gov.
If you are interested in using data from this report for rigorous purposes (such as program planning), please contact info@forsythfutures.org for a consultation on how best to proceed.
Housing Burden
When a significant portion of a household’s income is devoted to housing expenses, there is less money available to cover other basic needs such as food, health care, and transportation, a situation which may result in financial insecurity[1,2]. Housing cost burden measures housing expenses as a percentage of household income for homeowners and renters. The threshold for housing cost burden is when a household spends more than 30% of their income on housing expenses. Expenses include mortgage or rent payments, utilities, property taxes, insurance, and other fees.
- Cramer, R. & Shanks, T. (2014). The assets perspective: The rise of asset building and its impact on social policy. New York, NY: Palgrave Macmillan.
- Schwartz, M. & Wilson, E. (2007). Who can afford to live in a home?: A look at data from the 2006 American Community Survey. Retrieved from: https://www.census.gov/housing/census/publications/who-can-afford.pdf
Rates of housing burden rose significantly since 2007. Approximately, 40% of residents reported a housing cost burden in 2021 compared to 31% in 2007.
Forsyth County housing burden rates were higher than Durham County's rates.
Disparities were present in housing burden rates by age group in Forsyth County. Approximately 31% of residents between the ages of 25 to 44 were cost burdened compared to 52% of those under the age 25, 41% of those between the ages of 45 and 64, and 47% of those 65 years and older.
Race/Ethnicity: All estimates for Hispanic/Latino residents are not as reliable as the other race/ethnicity groups due to the small sample size of the population.
Age Group: All estimates for those 24 years old and younger are not as reliable as the other age groups due to the small sample size of the population.
Due to pandemic disruptions, 2020 data is not comparable to previous years.
Data Sources
- U.S. Census Bureau (2021). American Community Survey (ACS), 1-Year Public Use Microdata Sample (PUMS), 2007-2019 and 2021. Retrieved from Public Use Microdata Sample (PUMS).
If you are interested in using data from this report for rigorous purposes (such as program planning), please contact info@forsythfutures.org for a consultation on how best to proceed.
Income by Quintile
Changes in household incomes do not always happen uniformly for high-and low-income earners. For example, incomes could rise for high-earning households and stay the same or drop for lower-earning households.
Income quintiles help illuminate how much incomes are changing for high- versus low-income households in our community. Income quintiles are defined in percentiles using upper-limit thresholds. For example, in 2021, the 20th percentile quintile for Forsyth County had an upper limit of $23,970, meaning that the income of twenty percent of the population was less than $23,970. Due to the general nature of quintiles, income thresholds change from year to year.
| Percentile | Meaning | 2021 Income Level |
|---|---|---|
| 20th | 20% of households have income at or below this level | $23,970 |
| 40th | 40% of households have income at or below this level | $46,026 |
| 60th | 60% of households have income at or below this level | $75,559 |
| 80th | 80% of households have income at or below this level | $120,918 |
| 95th | 95% of households have income at or below this level | $235,564 |
Household income across the three lowest incomes in Forsyth County decreased significantly from 2010 to 2021. Residents in the 20th, 40th, and 60th percentiles had a decrease in their household income by approximately $4,000 to $5,830 from 2010 to 2021. For example, controlling for inflation, the lowest or 20th percentile quintile had a household income of $27,972 in 2010 compared to $23,970 which is a decrease of over $4,000.
Disparities were present in income percentiles by race/ethnicity. At the lower end of the income distribution, Black or African Americans were overrepresented and White, non-Hispanics were underrepresented. Conversely, at the higher end of the income distribution White, non-Hispanics are overrepresented and Black or African Americans and Hispanic/Latino residents were underrepresented.
All dollar amounts are expressed in 2021 dollars to control for inflation.
Due to pandemic disruptions, 2020 data is not comparable to previous years.
Data Sources
- U.S. Census Bureau (2021). Household Income Quintile Upper Limits: Table B19080, 2006-2019 and 2021 American Community Survey 1-Year Estimates. Retrieved from data.census.gov.
- U.S. Census Bureau (2021). American Community Survey (ACS), 1-Year Public Use Microdata Sample (PUMS), 2021. Retrieved from Public Use Microdata Sample (PUMS).
If you are interested in using data from this report for rigorous purposes (such as program planning), please contact info@forsythfutures.org for a consultation on how best to proceed.
Income Insufficiency
The following paragraphs provide an overview of Forsyth Futures' income insufficiency measure for Forsyth County. For more information on this measure's methodology, click here.
Income insufficiency is a measure of financial hardship that compares family income to estimated family expenses. While poverty rates are widely used as a measure of financial hardship, there is some evidence that poverty rates rely on outdated assumptions, which can lead to underestimated family expenses and financial hardship[1]. Forsyth Futures developed the income insufficiency measure to supplement analysis of financial hardship based on poverty rates. The income insufficiency measure accounts for factors not considered in poverty calculations.
This measure begins by documenting expense estimates, which represent the lowest cost of living that can be generally assumed for various family situations. This is followed by an analysis of income insufficiency rates, which are the percentages of residents living in families with incomes that are lower than their estimated expenses. The expense estimates used to calculate income insufficiency rates are based on demographic and geographic factors not considered in poverty calculations, as well as how each expense changes over time.
- National Research Council (1995). Measuring poverty: A new approach. Washington, D.C.: National Academy Press. Retrieved from: https://www.nap.edu/read/4759
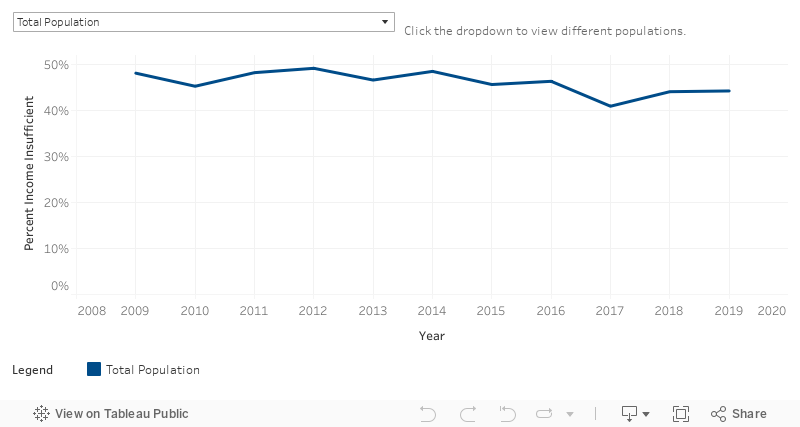
Table 1: List of Expenses Used to Calculate Income Insufficiency Click to View.
This table outlines sources for these expenses, each of which is similar or identical to those used by MIT and/or the United Way. All estimates are as sensitive to location and family circumstance as the available data allows. Countywide expense data were used whenever possible, however most expense categories were based on expense data calculated at the state or regional (Northeast, Midwest, South, West) level.
Table 2: Itemized List of Expenses by Example Household Composition Click to View.
This table shows the estimated expenses for several example households in Forsyth County. Compared to families with no children, families with children present in the household have significantly higher expenses. The example families above have children not attending school, which have the highest childcare expenses. School-aged children with working parents still have childcare expenses for after-school and summer care.
Table 3: Total Expenses Compared with Federal Poverty Threshold by Example Household Composition Click to View.
This table shows that total estimated expenses are consistently higher than the federal poverty threshold used by the Census Bureau to determine poverty status.
The income insufficiency rate was generally similar across time but there were some differences between comparison communities with one exception. In 2019, Forsyth County residents were more likely to be income insufficient than Durham County and the state of North Carolina residents.
Disparities were present in income insufficiency rates by age. Children under the age of 18 and young adults ages 18-24 were the most likely to be living in households with insufficient incomes at 72% and 58%, respectively, in 2019. Residents who were at least 45 years old were the least likely to live in households with insufficient income at 26%.
Disparities are present in income insufficiency rates by race/ethnicity. In 2019, about 57% of Black and 77% of Hispanic/Latino residents lived in income insufficient households compared to 31% of White residents.
The following paragraphs provide an overview of Forsyth Futures' income insufficiency measure for Forsyth County. For more information on this measure's methodology, click here.
The Census Bureau defines the poverty level of families based only on income, family size, and the number of children and adults 65 and over[2]. It does not consider location or any other factor that could influence expenses. As a result, in 2019, the average family of four was not considered to be in poverty if they had an income of at least $25,926 regardless of whether they lived in New York City or rural North Carolina. Additionally, there is some evidence that these estimates rely on outdated assumptions, which cause them to underestimate family expenses and financial hardship[1]. The flaws in the current measure are widely recognized. While researchers have been actively investigating alternative methodologies[3], the Census Bureau has not replaced its poverty calculations and researchers continue to commonly use Census Bureau poverty statistics[4].
Forsyth Futures attempted to address shortcomings in poverty calculations by creating alternative expense estimates based on a more detailed consideration of family circumstances. It built on similar analyses in the Self-Sufficiency Standard created by the Center for Women’s Welfare at the University of Washington for the United Way and the Living Wage Calculator developed by Dr. Amy Glasmeier at the Massachusetts Institute of Technology (MIT). Forsyth Futures’ model estimates eight categories of expenses:
- childcare
- food
- housing
- transportation
- healthcare
- health insurance
- other expenses
- taxes.
These estimates represent the lowest cost of living that can be generally assumed for each family type based on the information available; they are designed to identify income levels that could reasonably support families of different sizes.
- National Research Council (1995). Measuring poverty: A new approach. Washington, D.C.: National Academy Press. Retrieved from: https://www.nap.edu/read/4759
- S. Department of Commerce. (2017). Poverty thresholds – 2016 [Data File]. Retrieved from: https://www.census.gov/data/tables/time-series/demo/income-poverty/historical-poverty-thresholds.html
- Short, K. S. (2005). Material and financial hardship and income-based poverty measures in the USA. Journal of Social Policy, 34(1), 21-38. doi: 10.1017/S0047279404008244
- Chetty, R, & Hendren, N. (2015). The impact of neighborhoods on intergenerational mobility: County-level estimates . Retrieved from: https://scholar.harvard.edu/files/hendren/files/nbhds_paper.pdf
Median Income
Access to adequate financial resources is necessary for economic self-sufficiency. Median household income is an indicator of the financial resources available to middle-income households in our community. Median household income refers to the specific income level that is below the highest-earning 50% of households and above the lowest-earning 50% of households. Because income is closely tied to poverty, the Census Bureau and other studies use household income to determine poverty status[1,2].
- Kushel, M., Gupta, R., Gee, L., & Haas, J. (2006). Housing instability and food security as barriers to health care among low-income Americans. Journal of General Internal Medicine, 21(1), 71-77. doi: 1111/j.1525-1497.2005.00278.x
- S. Census Bureau, Poverty thresholds by size of family and number of children. (2017). Retrieved from https://www.census.gov/data/tables/time-series/demo/income-poverty/historical-poverty-thresholds.html
The median household income in Forsyth County was $59,879 in 2021. The median household income in 2021 was approximately $4,745 to $5,862 higher than the median household income in 2019 and 2018, respectively.
The median household income in Forsyth County was significantly lower than the national average from 2010 to 2021. The median national income was approximately $9,838 higher than Forsyth County’s median income in 2021. Also, in 2021 the median income was significantly higher in Durham County than in Forsyth County.
Householders between the ages of 25 to 44 and 45 to 64 had significantly higher median incomes than those under the age of 25 and those over the age of 65.
There were no significant differences between the median household income of residents with children present in the home than those without children present. While the estimate for households without a child present is slightly higher than households with a child present, that difference is within the margin of error in 2021.
The median household income was significantly less for Black or African American compared to Hispanic/Latino residents and non-Hispanic, White residents. The median income for White and Hispanic/Latino residents in 2021 was $34,516 and $25,421 higher than Black residents, respectively.
All dollar amounts are expressed in 2021 dollars to control for inflation.
When determining median income by age and race/ethnicity, this indicator only considers the age and race/ethnicity of the householder, who is the individual who filled out the Census Bureau’s American Community Survey.
Due to pandemic disruptions, 2020 data is not comparable to previous years.
Data Sources
- U.S. Census Bureau (2022). Median Income in the Past 12 Months (In 2021 Inflation-Adjusted Dollars): Table S1903, 2010-2019 and 2021 American Community Survey 1-Year Estimates. Retrieved from data.census.gov.
- U.S. Census Bureau (2022). Median Household Income in the Past 12 Months (in 2021 Inflation-Adjusted Dollars): Table B19013, 2017-2021 American Community Survey 5-Year Estimates. Retrieved from data.census.gov.
Residents Experiencing Poverty
In practical terms, poverty indicates insufficient financial resources to pay for basic needs such as food, housing, and health care[1,2]. It is important to note that while poverty rates are widely used as a measure of financial hardship, there is some evidence that poverty rates rely on outdated assumptions, which can lead to underestimated family expenses and financial hardship[3]. For an alternative measure to poverty, see the income insufficiency measure above.
View poverty thresholds by family size from the US Census Bureau.
- Kushel, M., Gupta, R., Gee, L., & Haas, J. (2006). Housing instability and food security as barriers to health care among low-income Americans. Journal of General Internal Medicine, 21(1), 71-77. doi: 1111/j.1525-1497.2005.00278.x
- S. Census Bureau, Poverty thresholds by size of family and number of children. (2021). Retrieved from https://www.census.gov/data/tables/time-series/demo/income-poverty/historical-poverty-thresholds.html
- National Research Council (1995). Measuring poverty: A new approach. Washington, D.C.: National Academy Press. Retrieved from: https://www.nap.edu/read/4759
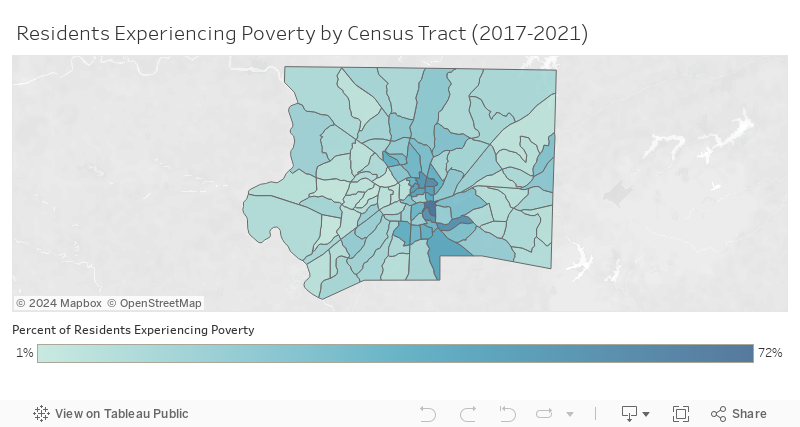
Forsyth County's poverty rate is decreasing. The poverty rate has decreased by 8 percentage points from 2012 to 2021.
Residents of Forsyth County experienced poverty at similar rates to other geographies. Forsyth County’s poverty rate was similar to that of Durham and Guilford counties and the rest of North Carolina and the United States.
Disparities were present in residents experiencing poverty by age. Residents in Forsyth County under the age of 18 were more likely to experience poverty compared to all age groups. In 2021, 20% of those under 18 experienced poverty compared to 13% of those 18 to 64 years old and 10% of those 65 and older.
Disparities were present in residents experiencing poverty by race/ethnicity. The poverty rates for Black or African American and Hispanic/Latino residents were higher than White, non-Hispanic residents.
Due to pandemic disruptions, 2020 data is not comparable to previous years. To learn more about these disruptions click here.
Hispanic/Latino estimates for the years 2007-2011, 2013-2014, 2016-2017, and 2021 are not as reliable due to the small sample size of the Hispanic/Latino population.
Data Sources
- U.S. Census Bureau (2022). Poverty Status in the Past 12 Months: Table S1701, 2006-2019 and 2021 American Community Survey 1-Year Estimates. Retrieved from data.census.gov.
- U.S. Census Bureau (2022). Poverty Status in the Past 12 Months: Table S1701, 2017-2021 American Community Survey 5-Year Estimates. Retrieved from data.census.gov.
If you are interested in using data from this report for rigorous purposes (such as program planning), please contact info@forsythfutures.org for a consultation on how best to proceed.
Additional Measures
Food Insecurity
The Forsyth County food insecurity rate in 2018 was 16%.
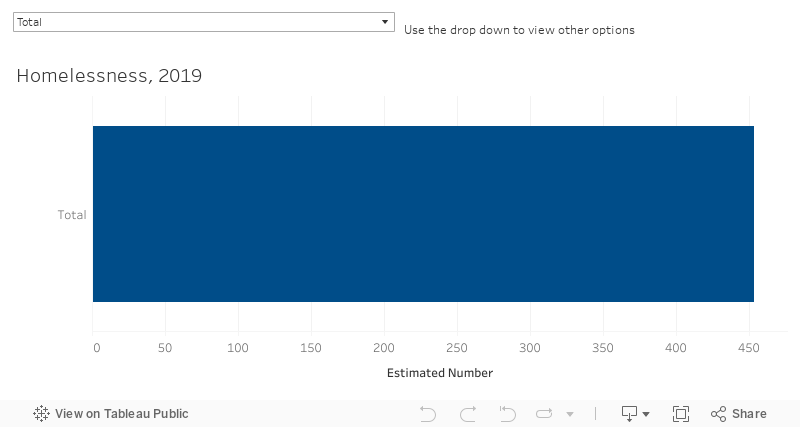
Homelessness
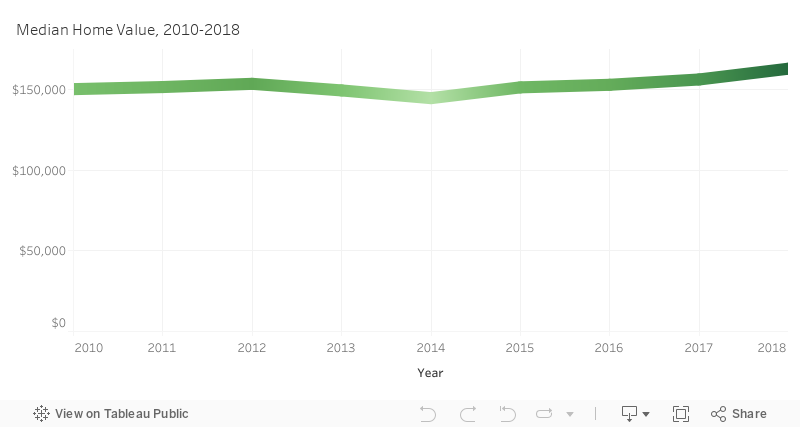
Home Values
Largest Employers
| Rank | Company | Employees | Industry |
|---|---|---|---|
| 1 | Atrium Health Wake Forest Baptist | 18,570 | Health Care |
| 2 | Novant Health | 11,010 | Health Care |
| 3 | Winston-Salem/Forsyth County Schools | 5,500 | Public Education |
| 4 | BB&T/Truist | 4,000 | Financial Services |
| 5 | Wells Fargo | 3,500 | Financial Services |
| 6 | Reynolds American | 2,500 | Tobacco Manufacturing |
| 7 | Hanesbrands | 2,400 | Clothing |
| 8 | City of Winston-Salem | 2,287 | Government |
| 9 | Wake Forest University | 2,270 | Higher Education |
| 10 | Forsyth County | 2,127 | Government |
| 11 | AT&T | 2,000 | Communications |
| 12 (tied) | Lowes Food Stores | 1,500 | Grocery Chain |
| 12 (tied) | Collins Aerospace Interiors | 1,500 | Aerospace Interiors |
| 13 (tied) | National General Insurance | 1,200 | Insurance |
| 13 (tied) | Forsyth Technical College | 1,200 | Education |
| 14 | Herbalife | 1,100 | Healthcare Supplements |
| 15 (tied) | YMCA of NWNC | 1,000 | Non-Profit |
| 15 (tied) | Winston-Salem State University | 1,000 | Higher Education |
| 16 | Inmar Inc. | 950 | Logistics & Data Analytics |
| 17 | Hayward Industries | 940 | Pumps & Pool Equipment |
| 18 | Flow Automotive Companies | 875 | Automotive Sales & Service |
| 19 | Deere-Hitachi | 850 | Excavators |
| 20 | The Budd Group | 750 | Landscaping |
| 21 (tied) | PepsiCo | 700 | Beverage Distribution |
| 21 (tied) | WestRock | 700 | Packaging |
| 22 | Cook Medical | 640 | Medical Device Manufacturing |
| 23 | Truiliant Federal Credit Union | 620 | Financial Services |
| 24 | Womble Bond Dickenson | 530 | Legal Services |
| 25 | Best Logistics Group | 505 | Logistics & Freight |
| 26 (tied) | IFB Solutions (Industries for the Blind) | 500 | Blind Services & Manufacturing |
| 26 (tied) | Johnson Controls Inc. | 500 | Controls Systems & Regulators |
Largest Industries
| Industry | Employees |
|---|---|
| Health care and social assistance | 30,473 |
| Manufacturing | 22,200 |
| Retail trade | 20,342 |
| Educational services | 15,179 |
| Professional, scientific, and technical services | 10,162 |
| Accommodation and food services | 9,889 |
| Construction | 9,102 |
| Transportation and warehousing, and utilities | 8,660 |
| Finance and insurance | 6,694 |
| Public administration | 6,006 |
| Administrative and support and waste management services | 5,432 |
| Other services, except public administration | 4,132 |
| Information | 2,268 |
| Arts, entertainment, and recreation | 1,568 |
| Agriculture, forestry, fishing and hunting, and mining | 577 |
| Management of companies and enterprises | 839 |
Reports and Briefings

Through a Gender Lens: The Economic Security of Women and Girls in Forsyth County in 2020
Produced by The Women’s Fund of the Winston-Salem Foundation in partnership with Forsyth Futures.
After seeing the importance of highlighting data that focused on the economic security of women and girls in Forsyth County, The Women’s Fund committed to producing a report of its nature every five years. While we chose a print format for our two previous reports, we decided to take a different approach with our third Through a Gender Lens report by presenting it as an interactive microsite with the goal to make the information more accessible and engaging.

Community Briefing: The Local Impact of COVID-19
Produced by Forsyth Futures; 2020
As we navigate the COVID-19 pandemic, local economic conditions are evolving faster than Forsyth Futures can measure using the data sources we typically rely on to inform community decision making. The purpose of this Briefing is to provide the most useful information possible about our rapidly-changing local economic conditions to community leaders and stakeholders. The report includes a dashboard, a literature review featuring interviews with local experts, and analyses of an expanded range of community measures. Our goal in producing this report is to encourage and support data-informed planning and decision making locally.
2020 Key Measures Report
Produced by Forsyth Futures.
Forsyth Futures’ Key Measures Report serves as a compilation of recent, commonly-requested, community-specific, reference information to aid informed public consideration and grant-writing activities in Forsyth County. The contents of this report address demographics and various topics related to the economy, health and wellness, education, and safety in Forsyth County.

The Benefits Cliff in Forsyth County, 2019
Produced by Forsyth Futures
The benefits cliff, or cliff effect, occurs when a small pay increase disqualifies a worker from public benefit programs and abruptly reduces his or her household resources, causing unexpected financial crisis. Forsyth County ranks among the worst counties in the nation for economic mobility. For a working family striving to advance economically, the sudden loss of public benefits is devastating.

The Legacy 2030 Update: The Comprehensive Plan for Winston-Salem, Forsyth County, and its Towns
Prepared for the Citizens of Forsyth County by the City-County Planning Board. Published in 2018.
The Planning Board appointed the 21-member Legacy Steering Committee with representatives from across Forsyth County to guide the visioning process. Over 100 citizens were enlisted by the steering committee and organized into eight focus groups. “Forsyth County Tomorrow” (to be referred to herein as Our Vision), was the first result of their efforts. Our Vision calls for growing smarter and better by managing future development. In fact, the title of the plan document, Legacy, identifies the overarching theme – we are stewards of the community and we have an obligation to protect and enhance it as our legacy to future generations.

Forsyth County Poverty Study, 2017
Produced by Forsyth Futures
The Forsyth County Poverty Study was carried out between 2015 and 2017 to inform efforts to improve the conditions of poverty in Forsyth County. A primary goal of the study was to identify which risk factors could contribute to poverty and disparities in poverty in Forsyth County. Forsyth Futures’ role in authoring the study was to provide a source of unbiased analyses to serve as a community resource; it was not Forsyth Futures’ role to identify or advocate for specific actions or policies.

Winston-Salem Poverty Thought Force Final Report, 2017
Produced by The Winston-Salem Poverty Thought Force. Includes analyses produced by Forsyth Futures.
Our Thought Force’s year-long engagement was informed by a wide range of advisers and community members. We engaged anti-poverty advocates and organizers, many of whom have devoted their careers to this cause; experts on various aspects of poverty, located both locally and nationally; concerned citizens who contribute resources of time, creative ideas, and money to help make a difference; and—most of all—residents living temporarily or longer-term in impoverished conditions, seeking a better life for themselves, their families, and their neighbors. These extraordinary helping hands are too many to name individually; we dedicate this report to them

A Second Look Through a Gender Lens: The Economic Security of Women and Girls in Forsyth County in 2015
Produced by The Women’s Fund of the Winston-Salem Foundation.
In 2010, The Women’s Fund published a report on women and girls in our community — the first time that data on the lives of more than half of our population had ever been assembled. That report, Through a Gender Lens: The Economic Security of Women and Girls in Forsyth County, told us a great deal about work, wages, poverty, education, and healthcare at the time, and women’s strengths overall and challenges they face. Women in our community were resilient, but too many were living without the financial resources they needed for a safe and secure life for themselves and for their children. We resolved to do better.

Emergency Food Assistance Efforts in Forysth County
Produced by Forsyth Futures, 2014
An Initiascape provides a map of the landscape of our community’s efforts about a particular initiative. It also serves as a resource directory of those programs that are connected through a common initiative. Initiascapes are designed to increase opportunities for collaboration and cooperation in order to more efficiently use our community’s resources. This Initiascape study about Emergency Food Assistance is designed to help connect the community “dots” of those who provide emergency food assistance in Forsyth County.
Forsyth County Community Food System
Produced by Forsyth Futures, 2013
In 2010, The Women’s Fund published a report on women and girls in our community — the first time that data on the lives of more than half of our population had ever been assembled. That report, Through a Gender Lens: The Economic Security of Women and Girls in Forsyth County, told us a great deal about work, wages, poverty, education, and healthcare at the time, and women’s strengths overall and challenges they face. Women in our community were resilient, but too many were living without the financial resources they needed for a safe and secure life for themselves and for their children. We resolved to do better.

Homelessness Making Progress Report
Produced by Forsyth Futures, 2013
The Making Progress Report: Homelessness is part of the Economic Self-Sufficiency series. Residents who are economically self-sufficient have the ability to care for themselves and their families without relying on assistance for basic needs. Other indicators within the series include: Income, Housing, Food Assistance, Employment, Employers Data and analysis of other indicators in the series are located on the Forsyth Futures’ website (www.forsythfutures.org). The following report provides a description of the homelessness indicator, identifies measures of homelessness and key findings, and examines what is needed Forsyth County to continue to Make Progress.
Education
Community Impact
Education is one of the strongest factors that impacts a person’s economic, health, and overall well-being. Several concepts contribute to both Academic Success and Educational Attainment, including neighborhood and family factors, social and emotional skills, health and wellness, enrichment and engagement, and academic behaviors.
Key Measures
Third Grade Reading
During the elementary and middle school years, students learn basic reading and math skills. These skills provide the basis for children and young adults to acquire, process, and interpret information about the world. If students do not develop this foundation of basic skills, it can impact their academic success at all future levels of education[1] (e.g. high school graduation, post-secondary completion, job placement, etc.).
From birth to about age eight, around third grade, children learn to read. After third grade, reading increasingly becomes a key part of instruction and how children learn. Children who are unequipped with basic reading skills at the end of third grade are at much greater risk of falling behind in school[1].
The measure used for Reading Proficiency is the reading test taken at the end of third grade. Proficiency on this test is defined as possessing the skills required to read at a third grade level.
- Annie E. Casey Foundation. (2010). EARLY WARNING! Why Reading by the End of Third Grade Matters.
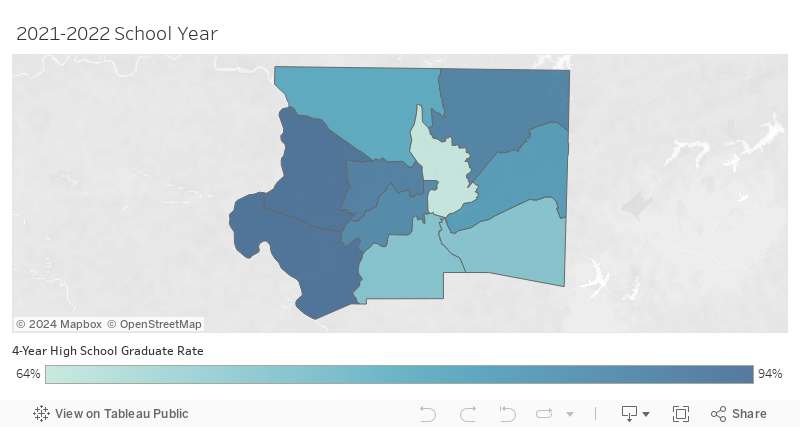
The rate of students meeting third grade reading proficiency standards has decreased over time. In the 2021-2022 school year, 40% met third grade reading proficiency standards compared to 58% of students in the 2013-2014 school year.
There were disparities in third grade reading proficiency by race/ethnicity. About a quarter (26%) of Hispanic/Latino and Black students met third grade reading proficiency standards in 2021-2022 compared to approximately 63% of White students.
There were disparities by sex with about 42% of females meeting third grade proficiency standards during the 2021-2022 school year compared to 39% of males.
There were disparities in third grade reading proficiency by economic status. In the 2021-2022 school year, about a quarter (26%) of economically disadvantaged students met proficiency standards compared to 55% of students who were not economically disadvantaged.
Data Sources
- North Carolina Department of Public Instruction. (n.d.). 2021-22 School Assessment and Other Indicator Data. Retrieved from https://www.dpi.nc.gov.
If you are interested in using data from this report for rigorous purposes (such as program planning), please contact info@forsythfutures.org for a consultation on how best to proceed.
Preparation for College and Career
Colleges and universities expect students to have the skills and knowledge to tackle college-level coursework. Students who are not proficient on the ACT are less likely to be prepared for college, more likely to frequently spend time and money taking remedial courses, and are less likely to be successful in completing their degree[1].
The American College Testing (ACT) assessment, which is taken by all 11th grade students in North Carolina, measures college readiness in reading, math, science, and English. In North Carolina, proficiency on the ACT is considered to be a composite score of 17 or above – the minimum score required for admission into the University of North Carolina system.
- Alliance for Excellent Education. (2011, May). Saving Now and Saving Later: How High School Reform Can Reduce the Nation’s Wasted Remediation Dollars. Retrieved from http://all4ed.org/wp-content/uploads/2013/06/SavingNowSavingLaterRemediation.pdf
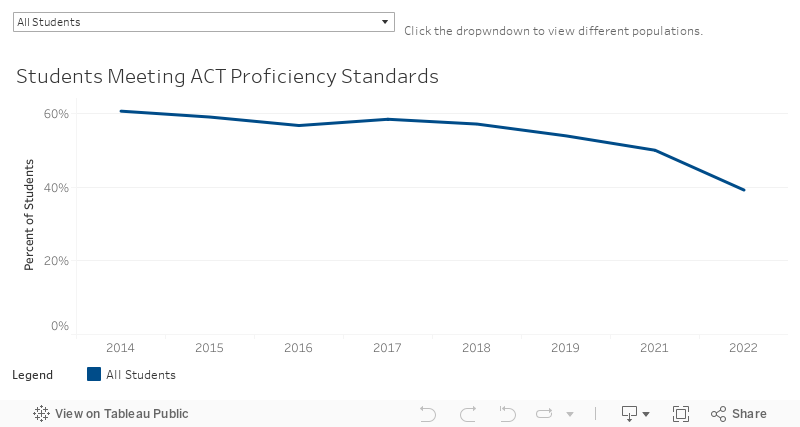
The rate of students meeting ACT proficiency standards has decreased over time. In the 2021-2022 school year, 39% met ACT proficiency standards compared to 61% of students in the 2013-2014 school year.
Disparities were present in ACT proficiency among students by economic status. About 17% of economically disadvantaged students met ACT proficiency standards compared to 51% of economically advantaged students.
Disparities were present in ACT proficiency among students by race/ethnicity. In 2021-2022, 18% of Black students and 20% of Hispanic/Latino students met ACT proficiency standards compared to about 64% of White students.
Disparities were present in ACT proficiency by sex. Female students had higher proficiency rates than males in the 2021-2022 school year.
Data Notes
Forsyth County schools had no ACT testing in the 2020-2021 school year due to the COVID-19 pandemic.
Data Sources
- North Carolina Department of Public Instruction. (n.d.). 2021-22 School Assessment and Other Indicator Data. Retrieved from https://www.dpi.nc.gov.
If you are interested in using data from this report for rigorous purposes (such as program planning), please contact info@forsythfutures.org for a consultation on how best to proceed.
Post-Secondary Completion
Education plays a significant role in social mobility, the prevention of poverty, the ability for people to avoid the conditions of poverty, and the reduction of crime rates[1-4]. Graduating from college or community college significantly increases the likelihood of an individual’s economic success[3-6].
Post-secondary education — education attained after high school — plays an important role in upward mobility[3]. This includes but is not limited to: college, community college, and university. This measure describes the percentage of the population, 25-years-old and older, with at least an associate’s degree.
While it is recognized that certificate programs are also important to a community, the data for such information is not currently available for analysis.
- Haskins, R. (2011). Fighting poverty the American way. Anti-Poverty Programs in a Global Perspective: Lessons from Rich and Poor Countries, Social Science Research Center, Berlin, [Record of a Symposium]. June 20-21, 2011. Berlin, Germany. Retrieved from https://www.brookings.edu/wp-content/uploads/2016/06/0620_fighting_poverty_haskins.pdf
- Acs, G. (2011). Downward mobility from the middle class: Waking up from the American dream. Retrieved from http://www.pewtrusts.org/~/media/legacy/uploadedfiles/pcs_assets/2011/middleclassreportpdf.pdf?la=en
- Furchtgott-Roth, D., Jacobson, L., & Mokher, C. (2009). Strengthening community colleges’ influence on economic mobility. Retrieved from http://www.frbsf.org/economic-research/files/Jacobson.pdf
- Sharkey, P., Bryan, G. (2013). Mobility and the metropolis: How communities factor into economic mobility. Retrieved from http://www.pewtrusts.org/~/media/legacy/uploadedfiles/pcs_assets/2013/mobilityandthemetropolispdf.pdf
- Ross, C., & Wu, C. (1995). The links between education and health. American Sociological Review, 60(5), 719-745. Retrieved from http://www.jstor.org/stable/2096319
- Lochner, L. (2007). Education and crime. Retrieved from http://economics.uwo.ca/people/lochner_docs/educationpolicycrime_nov12.pdf
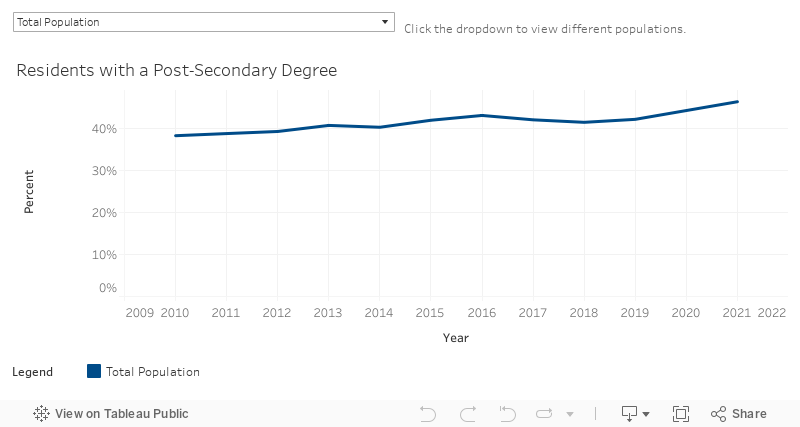
The percentage of the population with a post-secondary degree has increased since 2010. In Forsyth County, approximately 38% of residents had a post-secondary degree in 2010 compared to 46% in 2021. Additionally, the percentage of the population with a post-secondary degree from 2010 to 2021 increased for all comparison communities.
Educational attainment is significantly higher in Durham County. In 2021, 61% of Durham County residents had a post-secondary degree compared to the 44%-46% of residents in the other comparison communities.
There were significantly more female than male residents with a post-secondary degree in 2021. Further, there was an increase in females with a post-secondary degree from 38% in 2010 to 49% in 2021.
Disparities were present in residents with post-secondary degrees by age. Among all age groups, adults 65 years old and older have the lowest percentage of post-secondary degrees.
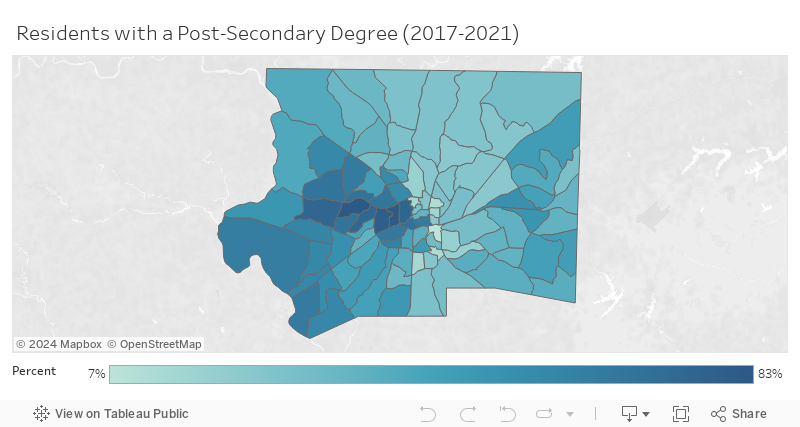
Disparities were present in residents with post-secondary degrees by race/ethnicity. In 2021, a higher proportion of White residents had a post-secondary degree than Hispanic/Latino residents or Black or African American residents. Additionally, the percentage of Hispanic/Latino residents with a post-secondary nearly tripled from 8% in 2010 to 23% in 2021.
Due to pandemic disruptions, 2020 data is not comparable to previous years.
Data Sources
- U.S. Census Bureau (2022). Sex by Age by Educational Attainment for the Population 18 Years and Over: Table B15001, 2006-2019 and 2021 American Community Survey 1-Year Estimates. Retrieved from data.census.gov.
- U.S. Census Bureau (2022). Sex by Age by Educational Attainment for the Population 25 Years and Over: Table B15002, 2006-2019 and 2021 American Community Survey 1-Year Estimates. Retrieved from data.census.gov.
- U.S. Census Bureau (2022). Sex by Age by Educational Attainment for the Population 25 Years and Over (Hispanic or Latino): Table B15002I, 2006-2019 and 2021 American Community Survey 1-Year Estimates. Retrieved from data.census.gov.
- U.S. Census Bureau (2022). Sex by Age by Educational Attainment for the Population 25 Years and Over (Black or African American Alone): Table B15002B, 2006-2019 and 2021 American Community Survey 1-Year Estimates. Retrieved from data.census.gov.
- U.S. Census Bureau (2022). Sex by Age by Educational Attainment for the Population 18 Years and Over: Table B15002, 2017-2021 American Community Survey 5-Year Estimates. Retrieved from data.census.gov.
If you are interested in using data from this report for rigorous purposes (such as program planning), please contact info@forsythfutures.org for a consultation on how best to proceed.
Additional Measures
High School Diploma or Higer
In 2018, 88.3% of Forsyth County residents had a high school diploma or higher. ACS Table S1501.
Associates Degree or Higher
In 2018, 41.5% of Forsyth County residents had an associates degree or higher. ACS Table 1501.
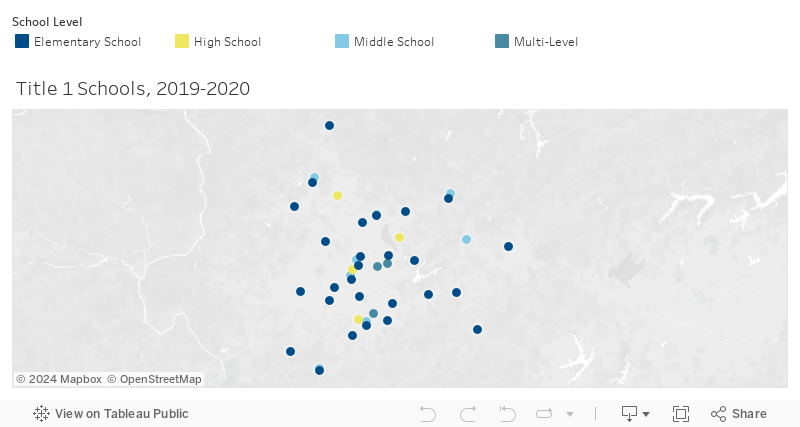
Title I Public Schools
Reports and Briefings
Through a Gender Lens: The Economic Security of Women and Girls in Forsyth County in 2020
Produced by The Women’s Fund of the Winston-Salem Foundation in partnership with Forsyth Futures.
After seeing the importance of highlighting data that focused on the economic security of women and girls in Forsyth County, The Women’s Fund committed to producing a report of its nature every five years. While we chose a print format for our two previous reports, we decided to take a different approach with our third Through a Gender Lens report by presenting it as an interactive microsite with the goal to make the information more accessible and engaging.
2020 Key Measures Report
Produced by Forsyth Futures.
Forsyth Futures’ Key Measures Report serves as a compilation of recent, commonly-requested, community-specific, reference information to aid informed public consideration and grant-writing activities in Forsyth County. The contents of this report address demographics and various topics related to the economy, health and wellness, education, and safety in Forsyth County.

The 2019 Forsyth Promise Community Education Report for Forsyth County
Produced by The Forsyth Promise in partnership with Forsyth Futures.
Striving toward systems change: the data and information contained in the 2019 Education Report for Forsyth County convey how our community is doing in regard to our most critical education measures. The Forsyth Promise’s goal is to support improvement of community-wide education measures for all students and support the reduction (and ultimate elimination) of disparity gaps by race/ethnicity and socioeconomic status

The 2018 Forsyth Promise Education Report for Forsyth County
Produced by The Forsyth Promise in partnership with Forsyth Futures.
The Forsyth Promise’s cradle-to-career civic infrastructure is designed to impact local systems and improve all students’ educational success. Significant change is defined as a change of at least two percentage points over three years. The following data convey how Forsyth County is doing in regard to our core education measures. The Promise’s immediate goal is to achieve two proof points for systems change: 1. at least four of seven core measures are stable or improving year over year for aggregate students and 2. at least two of five disparity gaps are reduced or eliminated.

Forsyth Family Voices
Produced by Forsyth Futures in partnership with MDC.
Forsyth Family Voices (FFV) is a powerful way to engage the voices of parents and families of young children in the programs that serve them—and in the community’s early childhood system. The FFV approach, using shared survey and focus group tools to listen to and learn from families, was developed collaboratively with a diverse, cross-sector group of agencies representing different fields within the early childhood system. Through FFV, agencies in the Forsyth County early childhood system are collectively building a deeper understanding of the needs, strengths, and ideas of the families they serve.

The 2016 Forsyth Promise Community Education Report for Forsyth County
Produced by The Forsyth Promise.
The Forsyth Promise is focused on supporting the development of the whole child and is built around improving six primary outcomes that are academic and social-emotional in nature. These outcomes span from birth to young adulthood (see the chart on the next page). For each outcome, at least one indicator, or a measure of success, was selected to track our community’s progress toward the vision of The Forsyth Promise.

Early Care Service System Analysis
Produced by Forsyth Futures, 2016.
Goals for the Early Care Service System Analysis (ECSSA): Build a common reference point for community services, identify gaps in services, identify opportunities for better coordination, create a framework for developing common community outcomes

The 2014 Forsyth Promise Community Education Report for Forsyth County
Produced by The Forsyth Promise.
The Forsyth Promise, a broad-based community partnership, wants to see every child in Forsyth County educated, equipped, and engaged from cradle to career. We want every child to receive the best education possible and be prepared to thrive throughout life. The information in this report provides a snapshot of our children’s educational outcomes at this moment in time as they make the journey from birth to young adulthood. We are inviting the entire community to work together to improve the educational and social outcomes for every child in Forsyth County.
A Second Look Through a Gender Lens: The Economic Security of Women and Girls in Forsyth County in 2015
Produced by The Women’s Fund of the Winston-Salem Foundation.
In 2010, The Women’s Fund published a report on women and girls in our community — the first time that data on the lives of more than half of our population had ever been assembled. That report, Through a Gender Lens: The Economic Security of Women and Girls in Forsyth County, told us a great deal about work, wages, poverty, education, and healthcare at the time, and women’s strengths overall and challenges they face. Women in our community were resilient, but too many were living without the financial resources they needed for a safe and secure life for themselves and for their children. We resolved to do better.
Winston-Salem Poverty Thought Force Final Report, 2017
Produced by The Winston-Salem Poverty Thought Force. Includes analyses produced by Forsyth Futures.
Our Thought Force’s year-long engagement was informed by a wide range of advisers and community members. We engaged anti-poverty advocates and organizers, many of whom have devoted their careers to this cause; experts on various aspects of poverty, located both locally and nationally; concerned citizens who contribute resources of time, creative ideas, and money to help make a difference; and—most of all—residents living temporarily or longer-term in impoverished conditions, seeking a better life for themselves, their families, and their neighbors. These extraordinary helping hands are too many to name individually; we dedicate this report to them

Making Progress Report: Children Ready for School
Produced by Forsyth Futures, 2013.
The Making Progress Report: Children Ready for School is part of the Educational Success sector. The following report provides a description of the children ready for school indicator, identifies measures of readiness, and establishes benchmarks for continuing to make progress in Forsyth County.
Health and Wellness
Community Impact
An individual’s mental and physical health and wellness impacts his or her quality of life in a variety of ways. People with positive health habits such as exercise and healthy eating can decrease health-related risk factors, while people who smoke or abuse drugs are at greater risk of health problems. Societal issues such as poverty, educational attainment, and safety can impact lifestyle choices that directly impact an individual’s health. A physically and mentally healthy community’s residents have positive health outcomes, practice health-promoting behaviors, and have uninhibited access to health care.
Key Measures
Infant Mortality
Infant health is often a leading indicator of not only the overall health of children but also of a community’s health[1]. One measure of infant health in a community is the infant mortality rate. Infant mortality rate refers to the number of deaths per 1,000 live births of children under one year of age.
- Kim, D., & Saada, A. (2013). The social determinants of infant mortality and birth outcomes in Western developed nations: a cross-country systematic review. International journal of environmental research and public health, 10(6), 2296-2335.
The infant mortality rate has remained relatively stable over time in Forsyth County. The rate ranged from approximately 6 to 10 deaths per 1,000 live births from 2010-2020.
The infant mortality rate across comparison communities was similar in 2020.
Disparities were present in the infant mortality rate for African American residents and White residents in 2020. The infant mortality rate for White residents was 4 deaths per 1,000 live births compared to about 12 deaths per 1,000 live births for African American residents. The difference in infant mortality rates between Hispanic and White residents was not statistically significant.
Data Sources
- NC Department of Health and Human Services. (2021, September 9). Infant Mortality Statistics 2020. Retrieved from https://schs.dph.ncdhhs.gov/data/vital.cfm
If you are interested in using data from this report for rigorous purposes (such as program planning), please contact info@forsythfutures.org for a consultation on how best to proceed.
Low Birthweight
Infant health is often a leading indicator of not only the overall health of children, but also of a community’s health. Infant health is associated with factors like maternal health, quality of and access to medical care, socioeconomic conditions, and public health practices[1]. One measure in determining overall infant health is the percent of low-birthweight babies born in a particular area. Infants born weighing under 2,500 grams (5 pounds, 8 ounces) are considered low-birthweight babies.
- Kim, D., & Saada, A. (2013). The social determinants of infant mortality and birth outcomes in Western developed nations: a cross-country systematic review. International journal of environmental research and public health, 10(6), 2296-2335.
The percentage of babies with a low-birthweight has remained stable in Forsyth County ranging from 10 to 11% from 2010 to 2021.
The percentage of babies with a low-birthweight was lowest among mothers between the ages of 25 and 34. About 9% of mothers 25 to 29 years old and 30 to 34 years old, respectively, had a low-birthweight baby in 2021 compared to 13% of mothers 20 years old and younger.
Comparison communities had similar rates of low-birthweight, but the percentage of babies with a low-birthweight in the state was 9% in 2021 compared to 11% in Forsyth and Guilford County.
Rates of low birthweight were lower for mothers with higher levels of educational attainment. In 2021, mothers with at least a Bachelor’s Degree had lower low-birthweight rates than mothers with less than a Bachelor’s Degree.
There were disparities in low birthweight rates by race/ethnicity. African American residents had a higher low-birthweight rate compared to White and Hispanic/Latino residents.
Unknown birth weights were excluded from analyses.
Data Sources
- NC Department of Health and Human Services. (2022, September 30). Baby Book Data (State of North Carolina 2021) Retrieved from https://schs.dph.ncdhhs.gov/data/vital/babybook/2021.htm
If you are interested in using data from this report for rigorous purposes (such as program planning), please contact info@forsythfutures.org for a consultation on how best to proceed.
Life Expectancy
Life expectancy is the average number of additional years that someone at a given age is expected to live[1]. Life expectancy is impacted by several factors including genetics, predisposed health conditions, living standard, and access to adequate healthcare[2-3]. Increased life expectancy can be attributed to higher educational attainment, rising living standards and improved health care access[2].
The life expectancy dashboard shows approximate life expectancy at birth.
- NC Department of Health and Human Services. (2020, December 16). Life Expectancy: North Carolina 1990-1992 and 2017-2019, State and County. https://schs.dph.ncdhhs.gov/data/lifexpectancy/
- OECDiLibrary (n.d.). Health Status: Life Expectancy at Birth. https://www.oecd-ilibrary.org/social-issues-migration-health/life-expectancy-at-birth/indicator/english_27e0fc9d-en
- World Health Organization (2014, March). WHO methods for life expectancy and healthy life expectancy. http://www.who.int/healthinfo/statistics/LT_method_1990_2012.pdf?ua=1
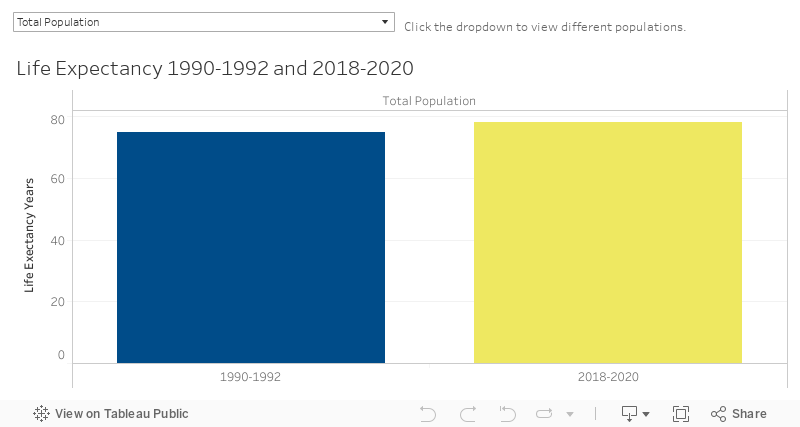
Life expectancy has increased from 1992-1994 to 2018-2020.
Forsyth County residents have a life expectancy of 78 years which is on par with Guilford County. Durham County had a life expectancy of 80 years, while North Carolina’s was 77.
Females have a significantly higher life expectancy than males. In Forsyth County, the life expectancy for females was 80 from 2018-2020 compared to 75 for males.
African Americans have a lower life expectancy than their White counterparts. White residents have a life expectancy 4 years higher than African American residents.
Data sources
- NC Department of Health and Human Services. (2022, March 7). Life Expectancy: North Carolina 1990-1992 and 2018-2020, State and County. Retrieved from https://schs.dph.ncdhhs.gov/data/lifexpectancy/.
If you are interested in using data from this report for rigorous purposes (such as program planning), please contact info@forsythfutures.org for a consultation on how best to proceed.
Drug Poisoning Deaths
Abuse of either legal or illegal drugs is referred to as substance abuse. Substance abuse negatively affects a person’s nutrition, their decision-making and impulsivity, and puts them at a higher risk of exposure to trauma, violence, injury, and death[3]. Drug poisoning deaths are recorded for any unintentional drug-induced death[1]. Drug addiction and overdose presents an extensive health crisis throughout the United States[2]. Nationally, unintentional drug poisoning (both pharmaceutical and illicit) is the leading cause of all unintentional injury deaths[4].
Deaths due to drug poisoning represent the number of unintentional deaths due to drug poisoning per 100,000 persons. To ensure comparison of standard populations, all rates given are age-adjusted.
- Centers for Disease Control and Prevention (CDC). (2021, December 22). Underlying Cause of Death 1999-2020.https://wonder.cdc.gov/wonder/help/ucd.html
- Wilson, N. (2020). Drug and opioid-involved overdose deaths—United States, 2017–2018. MMWR. Morbidity and Mortality Weekly Report, 69.
- National Institute on Drug Abuse. (2020, August 20). Commonly Used Drugs Charts. https://www.drugabuse.gov/drug-topics/health-consequences-drug-misuse/introduction
- Centers for Disease Control and Prevention (CDC). (2020, February 20). WISQARS: Leading cause of death reports, 2019. wisqars.cdc.gov

1-Year Data
From 2006 to 2020, drug poisoning deaths in Forsyth County tripled, from approximately 11 deaths per 100,000 to about 34 deaths per 100,000. Rates also significantly increased across both comparison counties and the state in that same time period.
In 2020, there were no significant differences between Forsyth County, Guilford County, and the state of North Carolina. Durham County had a much lower drug poisoning rate than Forsyth County.
5-Year Data
Males experienced more than twice as many drug poisoning deaths as females from 2016 to 2020.
White residents had double the amount of drug poisoning deaths as Black or African American residents from 2016 to 2020.
1-Year Data
Due to the CDC’s WONDER data set privacy policies, some of the yearly estimates at the county level were excluded.
5-Year Data
Individual yearly estimates by race/ethnicity and gender were omitted by CDC WONDER due to privacy policies. 5 year estimates (2016-2020) are used instead to compare estimates for males to females and Black or African-Americans to White residents. Hispanic/Latino residents were excluded from the 5 year estimates due to the unreliability of the estimates.
Data Sources
- Centers for Disease Control and Prevention, National Center for Health Statistics. Underlying Cause of Death 1999-2020 on CDC WONDER Online Database, released in 2021. Data are from the Multiple Cause of Death Files, 1999-2020, as compiled from data provided by the 57 vital statistics jurisdictions through the Vital Statistics Cooperative Program. Accessed at http://wonder.cdc.gov/ucd-icd10.html on Dec 27, 2021.
If you are interested in using data from this report for rigorous purposes (such as program planning), please contact info@forsythfutures.org for a consultation on how best to proceed.
Additional Measures
Adult Health
| Year | Rate | Source | Geography | |
|---|---|---|---|---|
| Percentage of adults who report their health to be poor or fair | 2023 | 13% | County Health Rankings | Forsyth County |
| Average number of poor physical health days reported by adults in past 30 days | 2023 | 2.9 days | County Health Rankings | Forsyth County |
| Average number of poor mental health days reported by adults in past 30 days | 2023 | 4.4 days | County Health Rankings | Forsyth County |
| Adult obesity | 2023 | 33% | County Health Rankings | Forsyth County |
| Adult smoking | 2023 | 17% | County Health Rankings | Forsyth County |
| Percentage of adults who visited a dentist or dental clinic | 2020 | 65% | CDC/500 Cities: Local Data for Better Health, 2017 release | Forsyth County |
| Percentage of adults reporting no leisure-time physical activity | 2023 | 21% | County Health Rankings | Forsyth County |
| Health Insurance — Rate of uninsured individuals | 2020 | 12% | U.S. Census Bureau/Small Area Health Insurance Estimates (SAHIE) | Forsyth County |
Various indicators of adult (individuals 18 years of age and older) health for various years, updated in 2020.
Youth Behavioral Health
| Alcohol, Tobacco & Other Drug Use | Percentage |
|---|---|
| Offered, Sold, or Given an Illegal Drug on School Property in Past 30 Days | 23% |
| Used Marijuana ≥ 1 Times in the Past 30 Days | 19% |
| Currently Binge Drink (Had ≥ 5 Drinks of Alcohol in a Row in a Couple Hours on ≥ 1 Days in the Past 30 Days) | 9% |
| Currently Drink Alcohol (Drink of Alcohol on ≥ 1 Days in the Past 30 days) | 20% |
| Currently Use Electronic Vapor Products on ≥ 1 Day in the Past 30 | 28% |
| Currently Smoke Cigarettes (Smoked Cigarettes on ≥ 1 Days in the Past 30 Days) | 8% |
| Ever Sniffed Chemicals (such as Glue or Paint) to Get a High | 8% |
| Ever Taken Drugs (such as OxyContin, Vicodin or Codeine) that were Not Prescribed for Them | 18% |
| Psychological Health | Percentage |
| Felt Sad or Hopeless Continuously for Two Weeks or More in the Past 12 Months | 35% |
| Seriously Considered Attempting Suicide During the Past 12 Months | 20% |
| Made a Suicide Plan During the Past 12 Months | 15% |
| Attempted Suicide During the Past 12 Months | 4% |
Various measures of child health based on the Winston Salem/Forsyth County High School Youth Risk Behavior Survey Results published by the Forsyth County Department of Public Health, 2017
Births by Race/Ethnicity and Education Level of Mother
| White, non-Hispanic | African American, non-Hispanic | Other, non-Hispanic | Hispanic/Latino | Total | |
|---|---|---|---|---|---|
| Less than HIgh School | 95 | 119 | 21 | 371 | 606 |
| HS Graduation or GED | 274 | 409 | 26 | 299 | 1008 |
| Some College | 581 | 517 | 25 | 175 | 1298 |
| College Degree (Bachelor's, Master's, PhD) | 95 | 234 | 90 | 101 | 1370 |
| Unknown | 0 | 4 | 2 | 2 | 8 |
| 2020 Forsyth Totals | 1895 | 1283 | 164 | 948 | 4290 |
Births by mothers’ race and education, 2018. North Carolina State Center for Health Statistics.
| Percent White, non-Hispanic | Percent African American, non-Hispanic | Percent Other, non-Hispanic | Percent Hispanic/Latino | Percent Total | |
|---|---|---|---|---|---|
| Less than HIgh School | 5% | 9% | 13% | 39% | 14% |
| HS Graduation or GED | 15% | 32% | 16% | 32% | 24% |
| Some College | 31% | 40% | 15% | 19% | 30% |
| College Degree (Bachelor's, Master's, PhD) | 50% | 18% | 55% | 11% | 32% |
| Unknown | 0% | 0% | 1% | 0% | 0% |
| 2020 Forsyth Totals | 44% | 30% | 4% | 22% | 100% |
Births by mothers’ race and education, 2018. North Carolina State Center for Health Statistics.
Mothers and Children
| Measure | Year | Rate or Percentage | Source |
|---|---|---|---|
| Adolescent Pregnancy Rate Among Females Ages 15 to 17 | 2016-2020 | 11.6 | NC State Center for Health Statistics, 2022 County Health Data Book, 2016-2020 Pregnancy Rates per 1,000 Population |
| Adolescent Pregnancy Rate Among Females Ages 15 to 19 | 2016-2020 | 23.4 | NC State Center for Health Statistics, 2022 County Health Data Book, 2016-2020 Pregnancy Rates per 1,000 Population |
| Infant Mortality Rate | 2020 | 7.2 | NC Department of Health & Human Services State Center for Health Statistics, Infant Mortality Rates per 1,000 Births |
| Percent of Children Ages 1-2 with Elevated Blood Lead Levels >= 5 | 2019 | 1.1% | Kids Count Data Center/ NC Department of Health & Human Services, Children’s Environmental Health Section: Childhood Lead Poisoning Prevention Program Surveillance Data |
Measures for mothers and children, 2014-2018 (updated early 2020).
Death and Disease
| Rate per 100,000 | |
|---|---|
| Age-Adjusted Cardiovascular Disease Death Rate | 205.6 |
| Age-Adjusted Heart Disease Death Rate | 146.7 |
| Age-Adjusted Stroke Death Rate | 43.6 |
| Age-Adjusted Diabetes Death Rate | 22.8 |
| Age-Adjusted Colorectal Cancer Death Rate | 12.8 |
| Age-Adjusted Trachea, Bronchus & Lung Cancer Death Rate | 47.4 |
| Age-Adjusted Female Breast Cancer Incidence Rate | 176.6 |
| Age-Adjusted Prostate Cancer Incidence Rate | 127.2 |
| Age-Adjusted Unintentional Motor Vehicle Injury Death Rate | 11.3 |
| Age-Adjusted Unintentional Injury Death Rate (excluding Motor Vehicle Deaths) | 36.4 |
| Age-Adjusted Homicide Rate | 6.3 |
| Age-Adjusted Suicide Rate | 11.2 |
Disease rates, 2013-2017. NCDHHS; NC County Trends Reports, February 2019
North Carolina Statewide and County Trends in Key Health Indicators: Forsyth County
Leading Causes of Death
| Deaths (2014-2018) | Age-Adjusted Rate per 100,000 | |
|---|---|---|
| Diseases of heart | 3,205 | 146.2 |
| Accidents (unintentional injuries) | 1,038 | 53 |
| Chronic lower respiratory diseases | 1,025 | 46.6 |
| Cerebrovascular diseases | 956 | 43.6 |
| Alzheimer's disease | 834 | 38.4 |
| Diabetes mellitus | 499 | 22.8 |
| Nephritis, nephrotic syndrome and nephrosis | 363 | 16.6 |
| Influenza and pneumonia | 408 | 18.4 |
| Septicemia | 325 | 14.7 |
| Intentional self-harm (suicide) | 223 | 11.4 |
| Chronic liver disease and cirrhosis | 187 | 8.5 |
| Homicide | 121 | 6.9 |
Leading causes of death. NCDHHS; NC 2020 County Health Data Book
2017 Race-Specific and Sex-Specific Age-Adjusted Death Rates by County: Forsyth County
https://schs.dph.ncdhhs.gov/data/databook/
Mortality Rate
Deaths: 3,611
Age-Adjusted Rate per 100,000: 959.6
CDC Wonder, Underlying Causes of Death, 2018.
Reports and Briefings
Through a Gender Lens: The Economic Security of Women and Girls in Forsyth County in 2020
Produced by The Women’s Fund of the Winston-Salem Foundation in partnership with Forsyth Futures.
After seeing the importance of highlighting data that focused on the economic security of women and girls in Forsyth County, The Women’s Fund committed to producing a report of its nature every five years. While we chose a print format for our two previous reports, we decided to take a different approach with our third Through a Gender Lens report by presenting it as an interactive microsite with the goal to make the information more accessible and engaging.
2020 Key Measures Report
Produced by Forsyth Futures.
Forsyth Futures’ Key Measures Report serves as a compilation of recent, commonly-requested, community-specific, reference information to aid informed public consideration and grant-writing activities in Forsyth County. The contents of this report address demographics and various topics related to the economy, health and wellness, education, and safety in Forsyth County.
A Second Look Through a Gender Lens: The Economic Security of Women and Girls in Forsyth County in 2015
Produced by The Women’s Fund of the Winston-Salem Foundation.
In 2010, The Women’s Fund published a report on women and girls in our community — the first time that data on the lives of more than half of our population had ever been assembled. That report, Through a Gender Lens: The Economic Security of Women and Girls in Forsyth County, told us a great deal about work, wages, poverty, education, and healthcare at the time, and women’s strengths overall and challenges they face. Women in our community were resilient, but too many were living without the financial resources they needed for a safe and secure life for themselves and for their children. We resolved to do better.
Winston-Salem Poverty Thought Force Final Report, 2017
Produced by The Winston-Salem Poverty Thought Force. Includes analyses produced by Forsyth Futures.
Our Thought Force’s year-long engagement was informed by a wide range of advisers and community members. We engaged anti-poverty advocates and organizers, many of whom have devoted their careers to this cause; experts on various aspects of poverty, located both locally and nationally; concerned citizens who contribute resources of time, creative ideas, and money to help make a difference; and—most of all—residents living temporarily or longer-term in impoverished conditions, seeking a better life for themselves, their families, and their neighbors. These extraordinary helping hands are too many to name individually; we dedicate this report to them

Understanding Access to Healthcare
Produced by Forsyth Futures, 2014.
With the implementation of the Affordable Care Act (ACA) health care in the United States is going through a transition. Understanding what primary health care resources are available in Forsyth County, and residents ability to access these resources can help community leaders plan for the transition. The purpose of the study Understanding Access to Health Care, is to provide an overview of health care resources and access to those resources before ACA was implemented. With support from HealthCare Access and the Kate B. Reynolds Charitable Trust, Forsyth Futures conducted an objective assessment of access to health care in Forsyth County.
Emergency Food Assistance Efforts in Forysth County
Produced by Forsyth Futures, 2014
An Initiascape provides a map of the landscape of our community’s efforts about a particular initiative. It also serves as a resource directory of those programs that are connected through a common initiative. Initiascapes are designed to increase opportunities for collaboration and cooperation in order to more efficiently use our community’s resources. This Initiascape study about Emergency Food Assistance is designed to help connect the community “dots” of those who provide emergency food assistance in Forsyth County.
Safety
Community Impact
Safety is foundational to an individual’s happiness and stability in life. Communities with lower crime rates often have a greater sense of community, higher property values, and are more attractive to businesses. Children who are shielded from crime and violence perform better in school, are less likely to be involved in high-risk behaviors such as substance abuse, and are less likely to become involved in criminal activity themselves as adults.
Key Measures
Accidental Death
Accidents or unintentional injuries are the third leading cause of death in the United States[1]. The three largest causes of deaths due to unintentional injuries are motor vehicle, drug poisoning, and falling accidents with drug poisoning deaths accounting for the largest rate of death per 100,000 people. Nationally, accidental deaths have increased significantly since the 1990s especially motor vehicle traffic deaths and unintentional drug overdoses[2].
For this report, accidental death is calculated as a rate expressed as resident deaths per 100,000 people. To ensure comparison of standard populations, all rates given are age-adjusted.
- Centers for Disease Control and Prevention (CDC), National Center for Health Statistics. (2021, October 19). Accidents or Unintentional Injuries. https://www.cdc.gov/nchs/fastats/accidental-injury.htm
- Olaisen, R. H., Rossen, L. M., Warner, M., & Anderson, R. N. (2019). Unintentional injury death rates in rural and urban areas: United States, 1999–2017. NCHS Data Brief, no. 343. Hyattsville, MD: National Center for Health Statistics.
Rates of accidental death were higher in recent years. In 2020, Forsyth County had approximately 76 accidental deaths per every 100,000 residents, compared to 33 deaths per 100,000 in 2006.
Forsyth County had higher accidental death rates than Durham County. The accidental death rate in Durham County was about 57 per every 100,000 residents which is almost 20 deaths per 100,000 residents fewer than Forsyth County’s rate.
Accidental death rates were highest for residents 65 and older.
Disparities were present in accidental death rates by gender. Males consistently had a higher rate of accidental death than females across all years.
Disparities were present in accidental death rates by race/ethnicity. White residents had a significantly higher rate of accidental death compared to Black or African American residents.
Age categories reflect collapsed age groups from CDC WONDER. Due to CDC WONDER’s privacy policies, some of the age groups’ yearly estimates were excluded in 2006 and 2008-2011. Additionally, the 2008 estimate for Black or African American residents was excluded due to privacy policies.
Data Sources
- Centers for Disease Control and Prevention, National Center for Health Statistics. Underlying Cause of Death 1999-2020 on CDC WONDER Online Database, released in 2021. Data are from the Multiple Cause of Death Files, 1999-2020, as compiled from data provided by the 57 vital statistics jurisdictions through the Vital Statistics Cooperative Program. Accessed at http://wonder.cdc.gov/ucd-icd10.html on Dec 27, 2021.
If you are interested in using data from this report for rigorous purposes (such as program planning), please contact info@forsythfutures.org for a consultation on how best to proceed.
Violent Crime
Crime is often an indication of the safety of a community and can influence a person’s perception of that community. Higher levels of violent crime are associated with higher levels of poverty and racial segregation[1,2]. An increase in the crime rate is detrimental to the health of a community and its residents[3].
As defined by the US Department of Justice, violent crime includes the offenses of murder, rape, robbery, and aggravated assault.
The rate of violent crime is measured by the number of occurrences per 100,000 individuals in a given population per year.
- Block, R. (1979). Community, Environment, and Violent Crime. Criminology.17(1):46-57.
- Speer, P.W., Gorman, D.M., Labouvie, E.W., Ontkush, M.J. (1998). Violent Crime and Alcohol Availability: Relationships in an Urban Community. Journal of Public Health Policy. 19(3):303-318.
- Office of Disease Prevention and Health Promotion. (2015). Social Determinants of Health. HealthyPeople.gov. Retrieved from http:/www.healthypeople.gov/2020/topics-objectives/topic/social-determinants-health
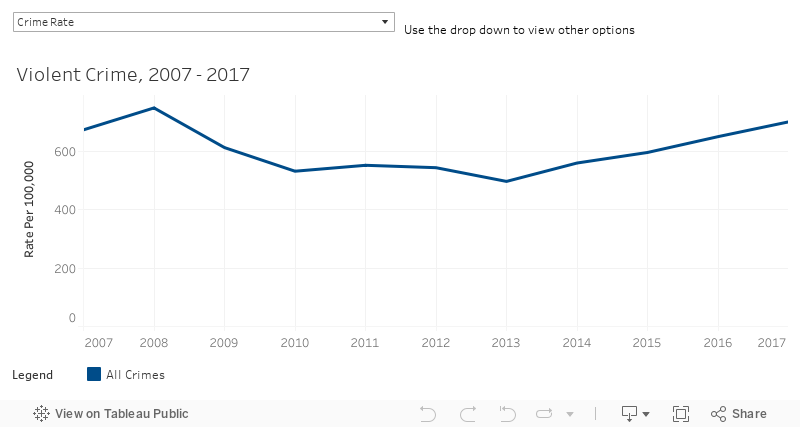
The violent crime rate decreased from 2008 to 2017 in Forsyth County. Violent crime is significantly higher in Durham County than in Forsyth County, but Forsyth County had a higher rate of violence in 2017 compared to Guilford County and the state of North Carolina.
The murder rate in Forsyth County remained relatively stable from 2008 to 2017. The murder rate is significantly smaller in Forsyth County than neighboring Guilford County.
While the sexual assault rate in the county remained fairly stable from 2008 to 2017, Forsyth County had a significantly higher prevalence of rape in 2017 compared to Guilford County and North Carolina.
The robbery rate significantly decreased from 237 people per 100,000 Forsyth County residents in 2008 to about 164 people per 100,000 Forsyth County residents in 2017. The 2017 robbery rate is significantly higher in Forsyth County than in the state of North Carolina, but is much lower than Durham County’s robbery rate.
The aggravated assault rate increased significantly from 2008 to 2017 in Forsyth County. About 495 people per 100,000 Forsyth County residents were assaulted in 2017 compared to 434 people per 100,000 Durham County residents, 390 people per 100,000 Guilford County residents, and 261 people per 100,000 North Carolinians.
Data are compiled from data provided by the 57 vital statistics jurisdictions through the Vital Statistics Cooperative Program.
Data Sources
- United States Department of Health and Human Services (US DHHS), Centers for Disease Control and Prevention (CDC), National Center for Health Statistics (NCHS), Underlying Cause of Death 1999-2016 on CDC WONDER Online Database, released 2017.
If you are interested in using data from this report for rigorous purposes (such as program planning), please contact info@forsythfutures.org for a consultation on how best to proceed.
Additional Measures
Child Maltreatment and Victimization
| Rate per 1,000 children | ||
|---|---|---|
| Annual rate of assessments for child maltreatment | 49 | |
| Annual rate of child victimization* | 31.3 |
Child maltreatment. Point in Time, 2017-2018. Assessments. Abuse and Neglect.
Abuse and Neglect
| Number of Cases | |
|---|---|
| Abuse and Neglect | 10 |
| Abuse | 12 |
| Neglect | 49 |
| Dependency | 7 |
| Services Needed | 119 |
| Services Provided, No Longer Needed | 59 |
| Services Recommended | 978 |
| Unsubstantiated | 183 |
| Services Not Recommended | 750 |
| Total Number of Children | 2,167 |
Abuse and neglect. Longitudinal data, 2018-2019.
Referral Sources
| Number | |
|---|---|
| Anonymous | 131 |
| Care Provider | 22 |
| Educational Personnel | 392 |
| Law Court | 396 |
| Medical Personnel | 463 |
| Relative | 258 |
| Non-Relative | 212 |
| Human Services | 175 |
| Victim | 4 |
| Parental | 124 |
| Total Number of Children* | 2167 |
Referral services. Longitudinal Data, 2018-2019.
http://sasweb.unc.edu/cgi-bin/broker?_service=default&_program=cwweb.tbReport.sas&county=Forsyth&label=County&type=CHILD&fn=FRST&vtype=ref&format=html&entry=11
Reports and Briefings
2020 Key Measures Report
Produced by Forsyth Futures.
Forsyth Futures’ Key Measures Report serves as a compilation of recent, commonly-requested, community-specific, reference information to aid informed public consideration and grant-writing activities in Forsyth County. The contents of this report address demographics and various topics related to the economy, health and wellness, education, and safety in Forsyth County.

Forsyth County Sheriff’s Office 2018 Annual Statistical Report
Produced by The Forsyth County Sheriff’s Office
The Forsyth County Sheriff’s Office Annual Statistical Report is a reflection of the past year’s accomplishments. This detailed informative report covers each Division, Section, and Unit of the Sheriff’s Office.
Social and Civic Environment
Community Impact
A community’s level of civic and social engagement is an indication of a community’s resilience, collective problem-solving capacity and ability to advocate for itself. Voter turnout, volunteerism and participation in local organizations are examples of civic engagement measures.
Key Measures
Electoral Participation
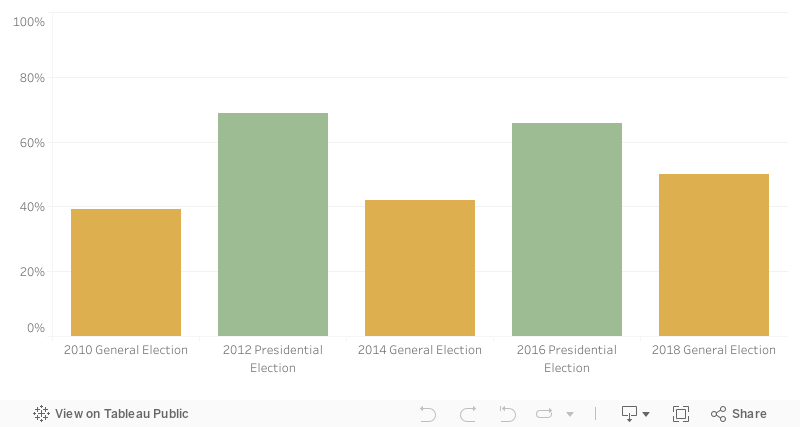
Concentrated Poverty
When a large portion of a neighborhood’s residents are experiencing poverty, there can be negative consequences for the entire neighborhood[1,2]. Residents living in areas of concentrated poverty may or may not be in poverty themselves, but are more likely to be in poverty in the future[2,4]. This effect is particularly pronounced for children; one study found that children were 50% more likely to have significantly less income than their parents when growing up in a high-poverty neighborhood[4].
- Kneebone, E., & Holmes, N. (2016). U.S. concentrated poverty in the wake of the great recession. Retrieved from https:/www.brookings.edu/research/u-s-concentrated-poverty-in-the-wake-of-the-great-recession
- Rothwell, J. (2014). The Neighborhood effect: Localities and upward mobility. Retrieved from https:/www.brookings.edu/blog/social-mobility-memos/2014/11/12/the-neighborhood-effect-localities-and-upward-mobility
- Kneebone, E., Nadeau, C., & Berube, A. (2011). The re-emergence of concentrated poverty. Retrieved from https://www.brookings.edu/research/the-re-emergence-of-concentrated-poverty-metropolitan-trends-in-the-2000s
- Sharkey, P. (2009). Neighborhoods and the black-white mobility gap. Retrieved from http:/www.pewtrusts.org/~/media/legacy/uploadedfiles/wwwpewtrustsorg/reports/economic_mobility/pewsharkeyv12pdf.pdf
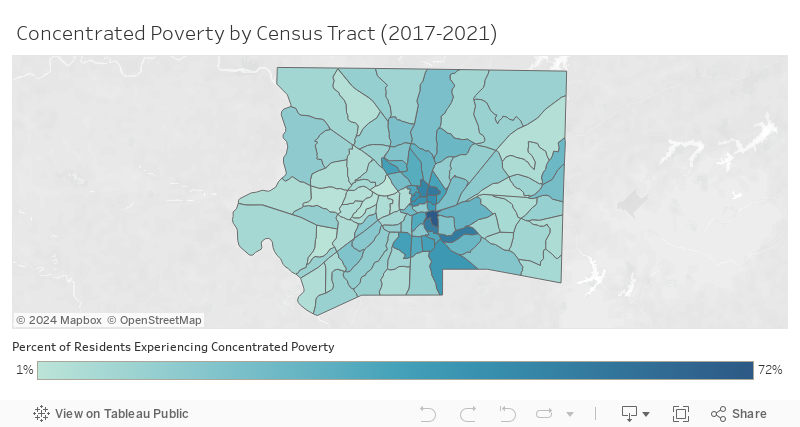
From 2017-2021, the concentrated poverty rate was 7% in Forsyth County which was a decrease from 2012-2016 when the rate was 9%.
Among all comparison communities, concentrated poverty was highest in Forsyth County.
Disparities were present in concentrated poverty rates by race/ethnicity. From 2017-2021, Black or African American and Hispanic/Latino residents had higher concentrated poverty rates than White, non-Hispanic residents.
Among all age groups, younger residents (under 18 years) had the highest rate of concentrated poverty from 2017-2021.
Due to pandemic disruptions, 2020 data is not comparable to previous years. To learn more about these disruptions click here.
Data Sources
- U.S. Census Bureau (2022). Poverty Status in the Past 12 Months: Table S1701, 2012-2016 and 2017-2021 American Community Survey 5-Year Estimates. Retrieved from data.census.gov.
Additional Measures
PLACEHOLDER ONLY
Reports and Briefings

2020 Census Community Briefing Microsite
Produced by the Forsyth County Complete Count Committee, in partnership with Forsyth Futures.
The Forsyth County Complete Count Committee, in partnership with Forsyth Futures, launched the Census 2020 Community Briefing Microsite as an information hub for community stakeholders to better understand why the 2020 Census matters and how we can work together for a complete and accurate count of our community.
Winston-Salem Poverty Thought Force Final Report, 2017
Produced by The Winston-Salem Poverty Thought Force. Includes analyses produced by Forsyth Futures.
Our Thought Force’s year-long engagement was informed by a wide range of advisers and community members. We engaged anti-poverty advocates and organizers, many of whom have devoted their careers to this cause; experts on various aspects of poverty, located both locally and nationally; concerned citizens who contribute resources of time, creative ideas, and money to help make a difference; and—most of all—residents living temporarily or longer-term in impoverished conditions, seeking a better life for themselves, their families, and their neighbors. These extraordinary helping hands are too many to name individually; we dedicate this report to them

Electoral Participation Making Progress Report
Produced by Forsyth Futures, 2013.
Forsyth Futures’ Making Progress Reports (MPR) serve as a tool to inform Forsyth County, N.C., residents about current issues, conditions, and trends in six areas: Economic Self-Sufficiency, Educational Success, Engaged Community, Physical and Mental Health, Safety, and Sustainable Environment. The Making Progress Report: Electoral Participation is part of the Engaged Community sector. In engaged communities, residents have a sense of ownership and pride in where they live. Measurements of engaged communities include voting rates, participation in community events, support and enjoyment of cultural opportunities, and levels of volunteering.
Key Measures help us better understand how our community is changing over time.
Additional Measures are less detailed than key measures and are intended to provide additional context for community uses such as grant writing and program planning.