
Community Data
Safety
Reliable local data encourages and supports data-informed decision making by community stakeholders at all levels. This information is designed to simplify the process of using data to inform the work that moves our community forward — program planning and evaluation, funding and resource allocation, grant writing, and more. If you have questions, please contact info@forsythfutures.org.
Key Measures
Key Measures help us better understand how our community is changing over time.
If you have questions, please contact info@forsythfutures.org.
Accidental Death
Accidents or unintentional injuries are the third leading cause of death in the United States[1]. The three largest causes of deaths due to unintentional injuries are motor vehicle, drug poisoning, and falling accidents with drug poisoning deaths accounting for the largest rate of death per 100,000 people. Nationally, accidental deaths have increased significantly since the 1990s especially motor vehicle traffic deaths and unintentional drug overdoses[2].
For this report, accidental death is calculated as a rate expressed as resident deaths per 100,000 people. To ensure comparison of standard populations, all rates given are age-adjusted.
- Centers for Disease Control and Prevention (CDC), National Center for Health Statistics. (2021, October 19). Accidents or Unintentional Injuries. https://www.cdc.gov/nchs/fastats/accidental-injury.htm
- Olaisen, R. H., Rossen, L. M., Warner, M., & Anderson, R. N. (2019). Unintentional injury death rates in rural and urban areas: United States, 1999–2017. NCHS Data Brief, no. 343. Hyattsville, MD: National Center for Health Statistics.
Rates of accidental death were higher in recent years. In 2020, Forsyth County had approximately 76 accidental deaths per every 100,000 residents, compared to 33 deaths per 100,000 in 2006.
Forsyth County had higher accidental death rates than Durham County. The accidental death rate in Durham County was about 57 per every 100,000 residents which is almost 20 deaths per 100,000 residents fewer than Forsyth County’s rate.
Accidental death rates were highest for residents 65 and older.
Disparities were present in accidental death rates by gender. Males consistently had a higher rate of accidental death than females across all years.
Disparities were present in accidental death rates by race/ethnicity. White residents had a significantly higher rate of accidental death compared to Black or African American residents.
Age categories reflect collapsed age groups from CDC WONDER. Due to CDC WONDER’s privacy policies, some of the age groups’ yearly estimates were excluded in 2006 and 2008-2011. Additionally, the 2008 estimate for Black or African American residents was excluded due to privacy policies.
Data Sources
- Centers for Disease Control and Prevention, National Center for Health Statistics. Underlying Cause of Death 1999-2020 on CDC WONDER Online Database, released in 2021. Data are from the Multiple Cause of Death Files, 1999-2020, as compiled from data provided by the 57 vital statistics jurisdictions through the Vital Statistics Cooperative Program. Accessed at http://wonder.cdc.gov/ucd-icd10.html on Dec 27, 2021.
If you are interested in using data from this report for rigorous purposes (such as program planning), please contact info@forsythfutures.org for a consultation on how best to proceed.
Violent Crime
Crime is often an indication of the safety of a community and can influence a person’s perception of that community. Higher levels of violent crime are associated with higher levels of poverty and racial segregation[1,2]. An increase in the crime rate is detrimental to the health of a community and its residents[3].
As defined by the US Department of Justice, violent crime includes the offenses of murder, rape, robbery, and aggravated assault.
The rate of violent crime is measured by the number of occurrences per 100,000 individuals in a given population per year.
- Block, R. (1979). Community, Environment, and Violent Crime. Criminology.17(1):46-57.
- Speer, P.W., Gorman, D.M., Labouvie, E.W., Ontkush, M.J. (1998). Violent Crime and Alcohol Availability: Relationships in an Urban Community. Journal of Public Health Policy. 19(3):303-318.
- Office of Disease Prevention and Health Promotion. (2015). Social Determinants of Health. HealthyPeople.gov. Retrieved from http:/www.healthypeople.gov/2020/topics-objectives/topic/social-determinants-health
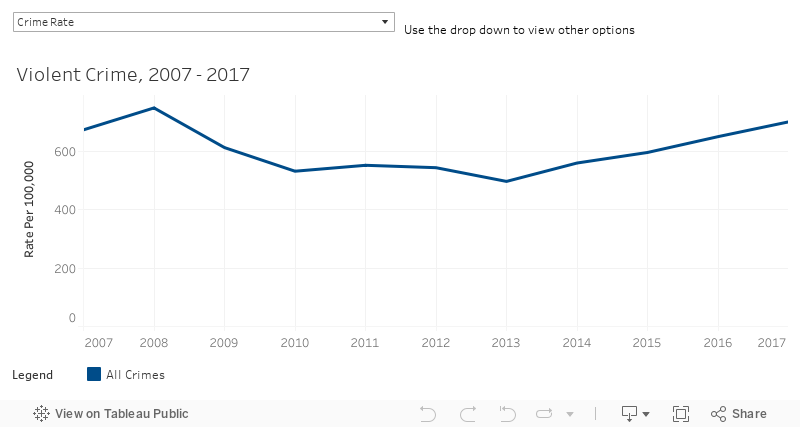
The violent crime rate decreased from 2008 to 2017 in Forsyth County. Violent crime is significantly higher in Durham County than in Forsyth County, but Forsyth County had a higher rate of violence in 2017 compared to Guilford County and the state of North Carolina.
The murder rate in Forsyth County remained relatively stable from 2008 to 2017. The murder rate is significantly smaller in Forsyth County than neighboring Guilford County.
While the sexual assault rate in the county remained fairly stable from 2008 to 2017, Forsyth County had a significantly higher prevalence of rape in 2017 compared to Guilford County and North Carolina.
The robbery rate significantly decreased from 237 people per 100,000 Forsyth County residents in 2008 to about 164 people per 100,000 Forsyth County residents in 2017. The 2017 robbery rate is significantly higher in Forsyth County than in the state of North Carolina, but is much lower than Durham County’s robbery rate.
The aggravated assault rate increased significantly from 2008 to 2017 in Forsyth County. About 495 people per 100,000 Forsyth County residents were assaulted in 2017 compared to 434 people per 100,000 Durham County residents, 390 people per 100,000 Guilford County residents, and 261 people per 100,000 North Carolinians.
Data are compiled from data provided by the 57 vital statistics jurisdictions through the Vital Statistics Cooperative Program.
Data Sources
- United States Department of Health and Human Services (US DHHS), Centers for Disease Control and Prevention (CDC), National Center for Health Statistics (NCHS), Underlying Cause of Death 1999-2016 on CDC WONDER Online Database, released 2017.
If you are interested in using data from this report for rigorous purposes (such as program planning), please contact info@forsythfutures.org for a consultation on how best to proceed.
Key Measures
Key Measures help us better understand how our community is changing over time.
If you have questions, please contact info@forsythfutures.org.
Accidental Death
About
Accidents or unintentional injuries are the third leading cause of death in the United States[1]. The three largest causes of deaths due to unintentional injuries are motor vehicle, drug poisoning, and falling accidents with drug poisoning deaths accounting for the largest rate of death per 100,000 people. Nationally, accidental deaths have increased significantly since the 1990s especially motor vehicle traffic deaths and unintentional drug overdoses[2].
For this report, accidental death is calculated as a rate expressed as resident deaths per 100,000 people. To ensure comparison of standard populations, all rates given are age-adjusted.
- Centers for Disease Control and Prevention (CDC), National Center for Health Statistics. (2021, October 19). Accidents or Unintentional Injuries. https://www.cdc.gov/nchs/fastats/accidental-injury.htm
- Olaisen, R. H., Rossen, L. M., Warner, M., & Anderson, R. N. (2019). Unintentional injury death rates in rural and urban areas: United States, 1999–2017. NCHS Data Brief, no. 343. Hyattsville, MD: National Center for Health Statistics.
Data
Key Points
Rates of accidental death were higher in recent years. In 2020, Forsyth County had approximately 76 accidental deaths per every 100,000 residents, compared to 33 deaths per 100,000 in 2006.
Forsyth County had higher accidental death rates than Durham County. The accidental death rate in Durham County was about 57 per every 100,000 residents which is almost 20 deaths per 100,000 residents fewer than Forsyth County’s rate.
Accidental death rates were highest for residents 65 and older.
Disparities were present in accidental death rates by gender. Males consistently had a higher rate of accidental death than females across all years.
Disparities were present in accidental death rates by race/ethnicity. White residents had a significantly higher rate of accidental death compared to Black or African American residents.
Data Notes
Age categories reflect collapsed age groups from CDC WONDER. Due to CDC WONDER’s privacy policies, some of the age groups’ yearly estimates were excluded in 2006 and 2008-2011. Additionally, the 2008 estimate for Black or African American residents was excluded due to privacy policies.
Data Sources
- Centers for Disease Control and Prevention, National Center for Health Statistics. Underlying Cause of Death 1999-2020 on CDC WONDER Online Database, released in 2021. Data are from the Multiple Cause of Death Files, 1999-2020, as compiled from data provided by the 57 vital statistics jurisdictions through the Vital Statistics Cooperative Program. Accessed at http://wonder.cdc.gov/ucd-icd10.html on Dec 27, 2021.
If you are interested in using data from this report for rigorous purposes (such as program planning), please contact info@forsythfutures.org for a consultation on how best to proceed.
Violent Crime
About
Crime is often an indication of the safety of a community and can influence a person’s perception of that community. Higher levels of violent crime are associated with higher levels of poverty and racial segregation[1,2]. An increase in the crime rate is detrimental to the health of a community and its residents[3].
As defined by the US Department of Justice, violent crime includes the offenses of murder, rape, robbery, and aggravated assault.
The rate of violent crime is measured by the number of occurrences per 100,000 individuals in a given population per year.
- Block, R. (1979). Community, Environment, and Violent Crime. Criminology.17(1):46-57.
- Speer, P.W., Gorman, D.M., Labouvie, E.W., Ontkush, M.J. (1998). Violent Crime and Alcohol Availability: Relationships in an Urban Community. Journal of Public Health Policy. 19(3):303-318.
- Office of Disease Prevention and Health Promotion. (2015). Social Determinants of Health. HealthyPeople.gov. Retrieved from http:/www.healthypeople.gov/2020/topics-objectives/topic/social-determinants-health
Data
Key Points
The violent crime rate decreased from 2008 to 2017 in Forsyth County. Violent crime is significantly higher in Durham County than in Forsyth County, but Forsyth County had a higher rate of violence in 2017 compared to Guilford County and the state of North Carolina.
The murder rate in Forsyth County remained relatively stable from 2008 to 2017. The murder rate is significantly smaller in Forsyth County than neighboring Guilford County.
While the sexual assault rate in the county remained fairly stable from 2008 to 2017, Forsyth County had a significantly higher prevalence of rape in 2017 compared to Guilford County and North Carolina.
The robbery rate significantly decreased from 237 people per 100,000 Forsyth County residents in 2008 to about 164 people per 100,000 Forsyth County residents in 2017. The 2017 robbery rate is significantly higher in Forsyth County than in the state of North Carolina, but is much lower than Durham County’s robbery rate.
The aggravated assault rate increased significantly from 2008 to 2017 in Forsyth County. About 495 people per 100,000 Forsyth County residents were assaulted in 2017 compared to 434 people per 100,000 Durham County residents, 390 people per 100,000 Guilford County residents, and 261 people per 100,000 North Carolinians.
Data Notes
Data are compiled from data provided by the 57 vital statistics jurisdictions through the Vital Statistics Cooperative Program.
Data Sources
- United States Department of Health and Human Services (US DHHS), Centers for Disease Control and Prevention (CDC), National Center for Health Statistics (NCHS), Underlying Cause of Death 1999-2016 on CDC WONDER Online Database, released 2017.
If you are interested in using data from this report for rigorous purposes (such as program planning), please contact info@forsythfutures.org for a consultation on how best to proceed.
Reports and Briefings
This section contains various reports that are relevant to the safety of our community. Listed reports may have been produced by Forsyth Futures or others in the community.
If you have questions, please contact info@forsythfutures.org.
Key Measures Report, 2020

Produced by Forsyth Futures.
Forsyth Futures’ Key Measures Report serves as a compilation of recent, commonly-requested, community-specific, reference information to aid informed public consideration and grant-writing activities in Forsyth County. The contents of this report address demographics and various topics related to the economy, health and wellness, education, and safety in Forsyth County.
Forsyth County Sheriff's Office Annual Statistical Report, 2018

Produced by The Forsyth County Sheriff’s Office
The Forsyth County Sheriff’s Office Annual Statistical Report is a reflection of the past year’s accomplishments. This detailed informative report covers each Division, Section, and Unit of the Sheriff’s Office.
Community Research Framework
Individual Forsyth Futures reports are generally written to provide focused information on specific issues to inform community action. While these topics are generally measured in separate reports for clarity, it is important to acknowledge that all of the local issues we study are interconnected. For example, food insecurity is generally measured separately from reading proficiency scores, but in reality being a part of a family experiencing food insecurity can have a significant impact on children’s ability to learn and be successful in school.
Two Complementary Frameworks
To guide our reporting as we navigate this complexity, Forsyth Futures uses two frameworks which consider interconnected topical dimensions and dimensions of context and scale, respectively. Taken together, these two frameworks provide an opportunity for community stakeholders to consider how issues that appear separate in their reporting may be interconnected.

Interconnected Topical Dimensions
This framework model shows that despite how topics are separated to make information easier to access and communicate, many of the sectors that we study are interconnected, like a student’s economic stability and their ability to be successful in school.
Built and Physical Environment
Economy and Financial Stability
Education
Health and Wellness
Safety
Social and Civic Environment

Dimensions of Context and Scale
This framework model is based on a commonly-used social determinants of health model called the Social-Ecological model. This model illustrates how individuals and families are impacted by the broader contexts in which they exist. For example, an individual child’s test score measures their reading proficiency at the individual level, but it is important to acknowledge the impact that a child’s family, neighborhood, and school have on the child’s success.